Utility Markers Market Size & Growth Forecast 2027–2036, By Segments (Function, Type, Application), Regional Demand Trends (North America, Asia Pacific, Europe), Key Country Insights (U.S., Japan, South Korea, Germany, France, Italy), and Competitive Landscape
Market Size and Growth Outlook
Utility Markers Market size was around USD 378.03 Million in 2026 and is slated to grow at 7.42% CAGR from 2027 to 2036, surpassing USD 773.35 Million by 2036. The industry revenue for 2027 is calculated at USD 401.85 Million.
Get more details on this report
Request Free Sample ReportUtility Markers Market Intelligence Snapshot
Regional Market Dynamics
- North America leads through extensive utility infrastructure, ongoing maintenance, infrastructure modernization, and standardized practices supporting reliable asset identification and safer utility work.
- Asia Pacific is the fastest-growing region as urbanization, utility network expansion, underground infrastructure investment, and infrastructure safety awareness increase demand.
Segment Momentum
- The passive segment leads due to cost-effective deployment, long operational life, and reliable underground infrastructure identification across gas, water, telecommunications, and power networks.
- Programmable markers are expanding rapidly as operators demand enhanced data storage, traceability, and intelligent asset management capabilities for complex utility networks.
Market Expansion Drivers
- Government mandates enforcing utility marking compliance to prevent underground infrastructure damage
- Infrastructure modernization projects increasing demand for advanced utility locating solutions
- Growing adoption of geospatial and real-time mapping technologies improving utility asset management
Leading Market Participants
- Leading players in the utility markers market include 3M Company (United States), Brady Corporation (United States), Seton Identification Products (United States), Tempo Communications Inc. (United States), Radiodetection Ltd (United Kingdom), HellermannTyton Group (United Kingdom), Berntsen International Inc. (United States), Panduit Corporation (United States), Grainger Inc. (United States), Trident Solutions Inc. (United States)
Global Market Forecast Snapshot
Market Outlook
- 2026 Market Size: USD 378.03 Million
- 2027 Estimated Market Size: USD 401.85 Million
- Projected Market Size: USD 773.35 Million by 2036
- Growth Forecast: 7.42% CAGR (2027-2036)
Regional and Segment Outlook
- Leading Regional Market: North America
- High-Growth Regional Hub: Asia Pacific
- Core Revenue Segment: Passive (Function) | Ball Markers (Type) | Water (Application)
- Emerging Opportunity Segment: Programmable (Function) | Ball Markers (Type) | Wastewater (Application)
Market Growth Drivers and Industry Trends
Government mandates enforcing utility marking compliance to prevent underground infrastructure damage
Stricter requirements for identifying and marking buried utilities are increasing demand for visible, durable systems that help contractors and infrastructure operators distinguish underground assets before excavation begins. The utility markers market is supported by compliance-driven installation practices designed to reduce accidental damage to gas, water, electricity, telecommunications, and other buried networks during construction and maintenance activities. Utility markers provide a standardized visual reference that improves site awareness and helps crews coordinate excavation work around existing infrastructure. As regulatory authorities and utility owners place greater emphasis on damage prevention and worker safety, reliable marking products are becoming an integral component of excavation planning and infrastructure maintenance workflows.
Infrastructure modernization projects increasing demand for advanced utility locating solutions
Aging underground networks are being upgraded alongside investments in roads, utilities, telecommunications, and public infrastructure, creating greater requirements for accurate identification of buried assets during construction and rehabilitation. The utility markers market benefits from these projects because modernization work frequently involves excavation in environments where multiple generations of infrastructure overlap, increasing the need for dependable locating and identification systems. Advanced markers can complement utility detection equipment by providing persistent physical references at known asset locations, helping field teams reduce uncertainty during excavation and maintenance. The expansion of fiber networks, water systems, power infrastructure, and transportation projects further increases the number of buried assets requiring clear identification and ongoing management.
Growing adoption of geospatial and real-time mapping technologies improving utility asset management
Digital mapping is transforming how infrastructure operators record, monitor, and maintain underground assets, creating opportunities for utility markers that can complement geospatial databases and field-location technologies. The utility markers market is gaining from the integration of physical identification systems with digital asset records, allowing field crews to connect visible markers with mapped information about the location and characteristics of buried infrastructure. Real-time positioning, GIS platforms, and digital utility maps can improve coordination between construction teams and asset owners while reducing reliance on fragmented paper-based records. Combining physical markers with accurate digital location data also supports faster field verification and more informed maintenance planning when infrastructure is distributed across large or complex sites.
| Growth Driver | Impact on CAGR | Regulatory Influence | Geographic Relevance | Adoption Rate | Impact Timeline |
|---|---|---|---|---|---|
| Government mandates enforcing utility marking compliance to prevent underground infrastructure damage | 3.2% | High | North America, Europe | High | Near Term |
| Infrastructure modernization projects increasing demand for advanced utility locating solutions | 2.6% | High | Asia Pacific, Middle East & Africa | High | Mid Term |
| Growing adoption of geospatial and real-time mapping technologies improving utility asset management | 2.1% | Moderate | North America, Europe | Medium | Mid Term |
Unlock insights tailored to your business with our bespoke market research solutions.
Click to get your customized report now.
Regional Demand Dynamics
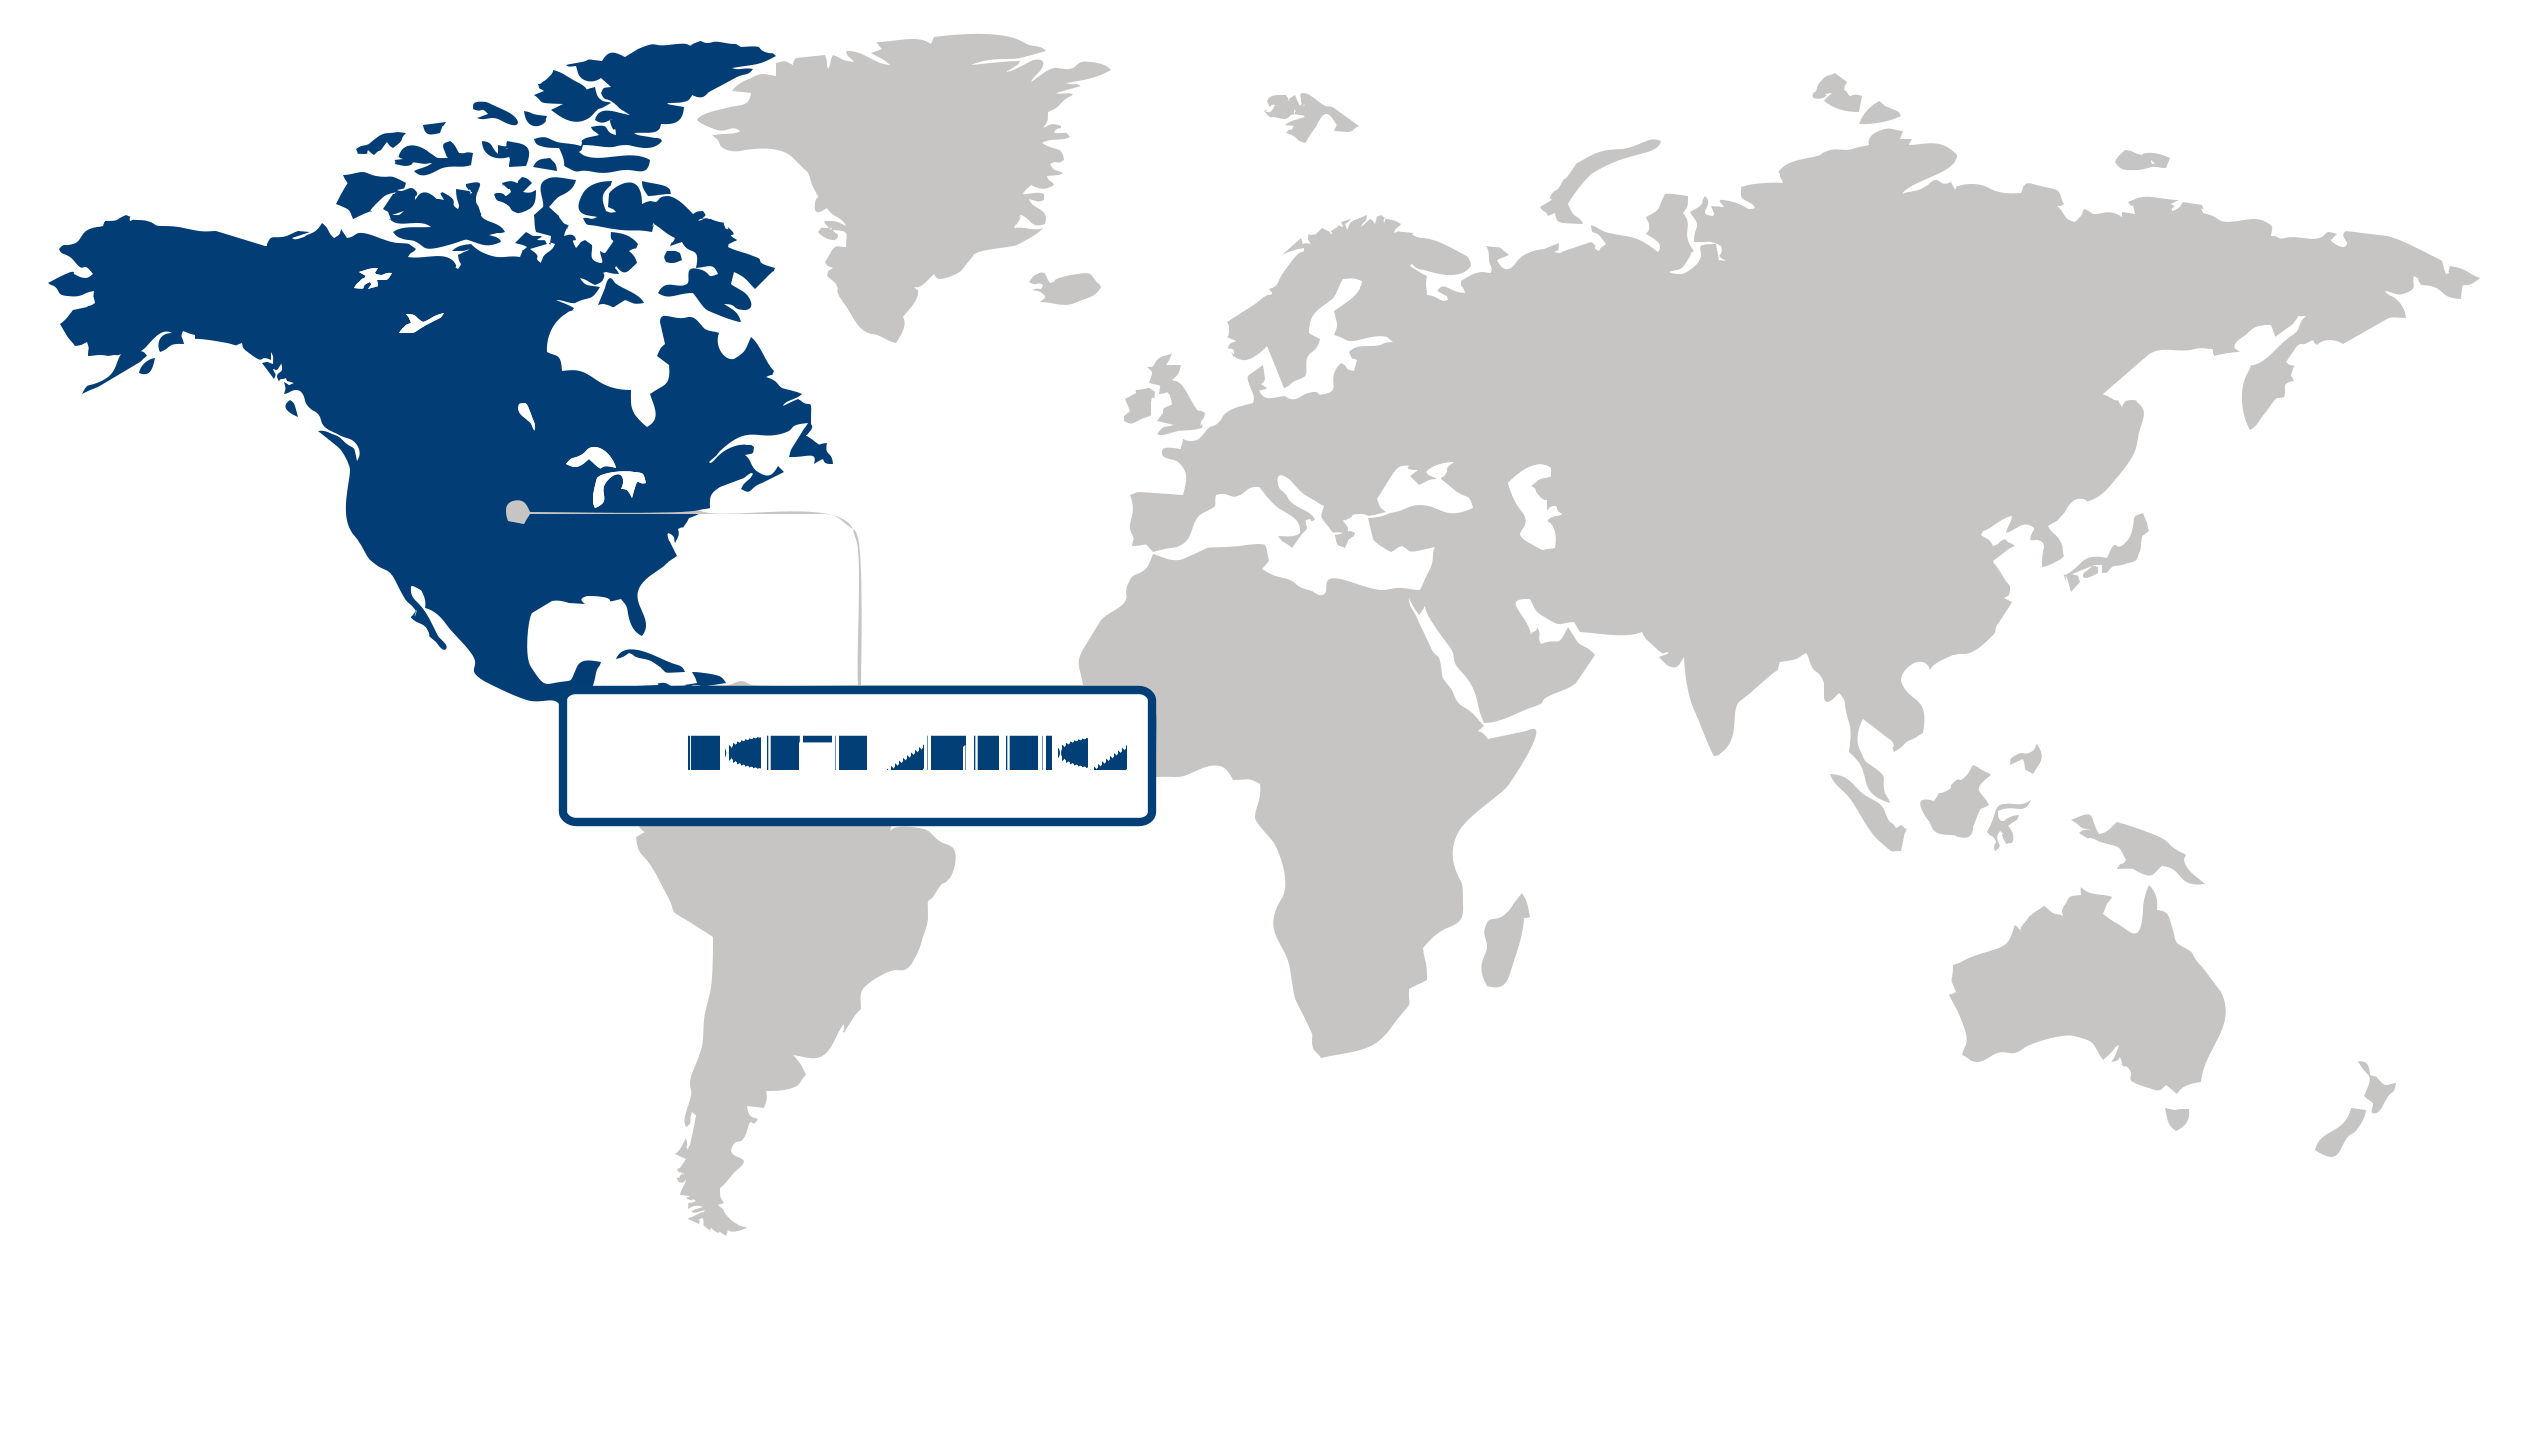
North America (Largest Region)
North America held the largest share of the utility markers market in 2026. The region benefits from extensive utility infrastructure and sustained requirements for identifying underground and above-ground utility assets across telecommunications, electricity, gas, water, and other infrastructure networks. Increasing infrastructure maintenance and development activities are supporting demand for visible and durable marking solutions that can improve asset identification and reduce the risks associated with excavation and utility work. The adoption of standardized utility management practices and continued infrastructure modernization further supports the region's established market position.
Asia Pacific (Fastest-Growing Region)
The utility markers market in Asia Pacific is expected to witness the fastest growth as infrastructure development, urbanization, and expansion of utility networks increase the need for effective asset identification solutions. Rapid development of telecommunications, power, water, and transportation infrastructure is creating broader applications for utility markers across both established and developing economies. In addition, investments in urban infrastructure and the expansion of underground utility systems are increasing the importance of clear utility identification, while growing awareness of infrastructure safety and maintenance requirements is supporting market adoption.
| Parameter | North America | Asia Pacific | Europe | Latin America | MEA |
|---|---|---|---|---|---|
| Innovation Hub i Scale Nascent Developing Advanced | |||||
| Cost-Sensitive Region i Scale Low Medium High | |||||
| Regulatory Environment i Scale Restrictive Neutral Supportive | |||||
| Demand Drivers i Scale Weak Moderate Strong | |||||
| Development Stage i Scale Emerging Developing Developed | |||||
| Adoption Rate i Scale Low Medium High | |||||
| New Entrants / Startups i Scale Sparse Moderate Dense | |||||
| Macro Indicators i Scale Weak Stable Strong |
Key Country Insights
United States 🇺🇸
Utility Network ProtectionThe U.S. continues to deploy utility markers extensively across energy, telecommunications, and water infrastructure projects. Utility operators prioritize durable identification solutions that improve excavation safety and support expanding underground network management programs.
Germany 🇩🇪
Infrastructure Identification StandardsGermany maintains strong demand for utility markers that align with rigorous infrastructure documentation and maintenance practices. Durable marking systems help utilities improve asset visibility while reducing risks during construction and maintenance activities.
Japan 🇯🇵
Dense Network IdentificationJapan relies on utility markers to improve identification of complex underground utility networks within densely developed urban areas. The market favors durable and highly visible solutions that support efficient maintenance and minimize excavation-related disruptions.
South Korea 🇰🇷
Smart Utility MappingSouth Korea is integrating utility markers with digital infrastructure management initiatives to improve underground asset identification. Demand is supported by infrastructure modernization projects that emphasize maintenance efficiency and construction safety.
France 🇫🇷
Municipal Asset VisibilityFrance continues to strengthen utility marker deployment across municipal infrastructure upgrades and public utility maintenance projects. Reliable identification systems help improve coordination among contractors while supporting safe excavation practices.
Italy 🇮🇹
Construction Safety SupportItaly is expanding the use of utility markers as infrastructure rehabilitation projects increase across transportation and utility networks. Utility operators value practical marking solutions that simplify underground asset identification and reduce operational disruptions during construction.
Segment Leadership and Growth Trends
Utility Markers Market Share (%), by Function, 2026
Go beyond the chart, access full insights & data tables
Request Free Sample ReportFunction Segment Analysis: Passive (Largest Segment) vs Programmable (Fastest-Growing Segment)
The passive function segment held the largest share of the market in 2026. Passive utility markers are widely utilized because they provide a reliable and cost-effective method of locating underground infrastructure without requiring an internal power source. Their durability, long operational life, and ease of deployment have made them a preferred solution for identifying buried utility assets across gas, water, telecommunications, and power networks. The extensive installed base of underground infrastructure continues to support strong demand for passive markers.
The programmable function segment is expected to witness the fastest growth as utility operators increasingly seek advanced asset identification and management capabilities. Programmable markers provide enhanced data storage, improved traceability, and greater flexibility for infrastructure monitoring applications. As utility networks become more complex and digital asset management practices gain importance, demand for intelligent marking solutions is rising rapidly across the sector.
Type Segment Analysis: Ball Markers (Largest & Fastest-Growing Segment)
In the utility markers market, the ball markers segment held the largest share of the market in 2026 and also emerged as the fastest-growing type category. Ball markers are extensively adopted because they can be detected accurately from multiple directions, simplifying underground asset location activities. Their robust design and ease of installation make them suitable for a wide range of utility marking applications. Increasing investments in utility maintenance, infrastructure upgrades, and damage prevention initiatives continue to strengthen the adoption of ball marker solutions across various industries.
Application Segment Analysis: Water (Largest Segment) vs Wastewater (Fastest-Growing Segment)
The water application segment accounted for the largest share of the market in 2026. Water distribution networks require reliable identification of underground assets to support maintenance activities, repair operations, and infrastructure expansion projects. Utility markers play a critical role in preventing accidental damage during excavation and ensuring efficient management of buried pipelines. Ongoing investments in water infrastructure modernization and network reliability continue to reinforce the segment’s dominant position.
The wastewater application segment is projected to be the fastest-growing category due to increasing investments in sanitation infrastructure and wastewater management systems. Municipalities and utility operators are focusing on upgrading aging networks and expanding treatment capacities to address growing environmental and public health requirements. As underground wastewater infrastructure becomes more extensive and complex, the need for accurate utility marking solutions is expected to increase significantly.
| Segment | Sub-Segment | Largest Segment | Fastest Growing |
|---|---|---|---|
| Function | Passive, Programmable | Passive | Programmable |
| Type | Ball Markers, Tape Markers, Disk Markers, Others | Ball Markers | Ball Markers |
| Application | Gas, Telecommunication, Water, Power, Wastewater | Water | Wastewater |
Competitive Landscape and Market Positioning
Major players in the utility markers market:
- 3M Company (United States)
- Brady Corporation (United States)
- Seton Identification Products (United States)
- Tempo Communications, Inc. (United States)
- Radiodetection Ltd (United Kingdom)
- HellermannTyton Group (United Kingdom)
- Berntsen International, Inc. (United States)
- Panduit Corporation (United States)
- Grainger, Inc. (United States)
- Trident Solutions, Inc. (United States)
The utility markers market is experiencing a competitive transition driven by the need for more durable, visible, and application-specific identification solutions across underground infrastructure networks. Suppliers are differentiating through improved material performance, enhanced visibility features, and designs suited for expanding utility management requirements. Competition is also being influenced by infrastructure modernization efforts, where providers capable of supporting varied field conditions and compliance expectations are better positioned to maintain long-term customer relationships.
| Company | Market Share | Company Revenue | Revenue CAGR (%) | Product Portfolio | Geographic Presence | Innovation / R&D Focus | Strategic Developments |
|---|---|---|---|---|---|---|---|
| 3M Company (United States) | |||||||
| Brady Corporation (United States) | |||||||
| Seton Identification Products (United States) | |||||||
| Tempo Communications Inc. (United States) | |||||||
| Radiodetection Ltd (United Kingdom) | |||||||
| HellermannTyton Group (United Kingdom) | |||||||
| Berntsen International Inc. (United States) | |||||||
| Panduit Corporation (United States) | |||||||
| Grainger Inc. (United States) | |||||||
| Trident Solutions Inc. (United States) |
Industry Development/News
| Company Name | Date | Key Development |
|---|---|---|
| Trident Solutions | Jan-22 | Trident Solutions acquired LEM Products, Inc., a specialized manufacturer of industrial identification products. The strategic acquisition broadens its product portfolio in safety marking and identification systems for utility applications. |
| Tempo Communications, Inc. | Aug-19 | Tempo Communications, Inc. launched the next-generation Omni Marker II ball system. The updated variant incorporates an enhanced patented design and advanced technology to improve location precision for eco-friendly utility marker applications. |
Customize Your Report
Explore examples of how this report can be tailored to different research needs, including custom segments, additional topics or chapters, and related reports. Click a section of the wheel or its numbered marker to explore the available options.
Utility Markers Market — Custom Segments
| Segment | Sub-Segment |
|---|---|
| Utility Infrastructure Ownership | Public Utilities, Private Utilities, Municipal Utilities, Utility Contractors |
| Installation Environment | Urban Areas, Suburban Areas, Rural Areas, Industrial & Commercial Sites |
| Procurement Channel | Direct Procurement, Utility Distributors, Specialty Infrastructure Suppliers, Contractor Procurement |
Utility Markers Market — Custom TOC
| Custom Chapter | Custom Details |
|---|---|
| Utility Damage Prevention Strategy |
|
| Procurement and Contractor Buying Behavior |
|
| Smart Utility Marking Adoption |
|
Need a different cut of the data?
Request Custom ResearchHow much revenue does the utility markers market generate?
What are the growth projections for the utility markers industry?
How is infrastructure modernization influencing demand for utility marking solutions?
Why are digital technologies becoming important in utility asset management strategies?
Why is the passive function segment widely adopted in the utility markers market?
What is driving growth of programmable utility markers?
Why does North America lead the utility markers market?
How is Asia Pacific driving future utility markers market growth?
What are the prominent companies operating in the utility markers landscape?
Our Clients
"Your insights on workforce structures were spot-on. The analysis on mid-to-senior level roles validated some of our hiring decisions and highlighted gaps."
Ateliers De France
"The report gave us insights on competitors in the market. It helped our team refine our bidding strategy for upcoming contracts."
Clark Construction
"The reports provided a deep dive into market trends, and competitive landscape. The strategic insights and recommendations have been very helpful."
Rudolph and Sletten
Our Research Team & Methodology
Every Fundamental Business Insights report is built by a dedicated vertical research team, validated through a structured primary-and-secondary methodology, and reviewed for accuracy before it reaches you.
Research Team Overview
Prepared by the Construction & Manufacturing Research Team
Delivery
Published
Demand
Available
Support
Trust & Compliance
Research Domains
10 coverage areasResearch Intelligence
| Source | Reference |
|---|---|
| International Organization for Standardization (ISO) | www.iso.org |
| ASTM International | www.astm.org |
| National Institute of Standards and Technology (NIST) | www.nist.gov |
| International Code Council (ICC) | www.iccsafe.org |
| American Concrete Institute (ACI) | www.concrete.org |
| American Institute of Steel Construction (AISC) | www.aisc.org |
| Construction Industry Institute (CII) | www.construction-institute.org |
| Associated General Contractors of America (AGC) | www.agc.org |
| Association of Equipment Manufacturers (AEM) | www.aem.org |
| Building Owners and Managers Association (BOMA) | www.boma.org |
| American Society of Civil Engineers (ASCE) | www.asce.org |
| National Ready Mixed Concrete Association (NRMCA) | www.nrmca.org |
| International Facility Management Association (IFMA) | www.ifma.org |
| World Green Building Council (WorldGBC) | worldgbc.org |
| International Federation of Consulting Engineers (FIDIC) | fidic.org |
| International Labour Organization (ILO) | www.ilo.org |
| American Society of Mechanical Engineers (ASME) | www.asme.org |
| Society of Manufacturing Engineers (SME) | www.sme.org |
| National Association of Home Builders (NAHB) | www.nahb.org |
| European Construction Industry Federation (FIEC) | www.fiec.eu |
Research Workflow & Quality Assurance
Data Collection
Verified information gathered through primary and secondary research.
Data Triangulation
Cross-validation using multiple independent data sources.
Forecast Modelling
Market estimates developed using historical trends and analytical models.
Analyst Validation
Findings reviewed by domain experts for accuracy and consistency.
Editorial & Quality Review
Final editorial, quality, and compliance checks before publication.
Final Publication
Released after successful completion of the internal review process.
Report Coverage
📊 Market Assessment
- Market Size & Forecast
- Market Segmentation
- Regional Analysis
- Growth Drivers & Challenges
- Market Dynamics
🏢 Competitive Intelligence
- Competitive Landscape
- Company Profiles
- Competitive Benchmarking
- Mergers & Acquisitions
- Market Share Analysis or Key Company Strategies
🔍 Strategic Analysis
- Value Chain Analysis
- Porter's Five Forces
- PESTLE Analysis
- Pricing Trends
- Supply-Demand Analysis
🚀 Future Outlook
- Technology Landscape
- Regulatory Landscape
- Investment & Funding Landscape
- Emerging Opportunities
- Future Market Outlook
Have a question about this report or need a custom scope?
Request Customization