Reduced Salt Food Products Market Size & Growth Forecast 2027–2036, By Segments (Distribution Channel, Product Type), Regional Demand Trends (North America, Asia Pacific, Europe), Key Country Insights (U.S., Japan, South Korea, Germany, France, Italy), and Competitive Landscape
Market Size and Growth Outlook
Reduced Salt Food Products Market size was estimated at USD 390.46 billion in 2026 and is projected to grow at a 4.85% CAGR from 2027 to 2036, surpassing USD 626.99 billion by 2036. The industry revenue for 2027 is calculated at USD 406.39 billion.
Get more details on this report
Request Free Sample ReportReduced Salt Food Products Market Intelligence Snapshot
Regional Market Dynamics
- Asia Pacific accounted for 37.21% of the market in 2026, supported by its extensive food manufacturing industry, high packaged food consumption, and widespread sodium-reduction initiatives across product categories.
- North America is projected to grow at a 5.88% CAGR as food manufacturers expand sodium-reduction reformulation efforts and consumers increasingly adopt healthier packaged food alternatives.
Segment Momentum
- Offline channels hold a 75.84% share due to strong supermarket and hypermarket presence. Consumers prefer in-store label comparison and familiar grocery purchasing patterns.
- Online is the fastest-growing channel as health-conscious consumers increasingly seek targeted dietary products. E-commerce improves access, comparison, and convenience for niche reduced salt options.
Market Expansion Drivers
- Rising chronic disease prevalence accelerating demand for low sodium food alternatives.
- Increasing consumer health awareness driving shift toward reduced salt dietary consumption.
- Government-led sodium reduction initiatives pushing reformulation of packaged food products.
Leading Market Participants
- Top players in the reduced salt food products market include Nestlé S.A. (Switzerland), PepsiCo, Inc. (United States), General Mills, Inc. (United States), Kellogg Company (United States), The Kraft Heinz Company (United States), Conagra Brands, Inc. (United States), Tyson Foods, Inc. (United States), Hormel Foods Corporation (United States), Maple Leaf Foods Inc. (Canada), Smithfield Foods, Inc. (United States).
Global Market Forecast Snapshot
Market Outlook
- 2026 Market Size: USD 390.46 billion
- 2027 Estimated Market Size: USD 406.39 billion.
- Projected Market Size: USD 626.99 billion by 2036
- Growth Forecast: 4.85% CAGR (2027-2036)
Regional and Segment Outlook
- Leading Regional Market: Asia Pacific
- High-Growth Regional Hub: North America
- Core Revenue Segment: Offline (Distribution Channel) | Snacks (Product Type)
- Emerging Opportunity Segment: Online (Distribution Channel) | Snacks (Product Type)
Market Growth Drivers and Industry Trends
Rising chronic disease prevalence accelerating demand for low sodium food alternatives
The growing incidence of hypertension, cardiovascular conditions, and other chronic diseases is strengthening demand for dietary options that support healthier sodium intake, which will drive the reduced salt food products market growth. Consumers managing long-term health risks are increasingly seeking food products that contain less sodium without requiring major changes to their established eating habits. This trend is encouraging food manufacturers to develop reduced-salt versions of commonly consumed packaged foods, including prepared meals, snacks, sauces, and other processed products, while maintaining acceptable taste and product functionality. The need to align everyday food consumption with preventive health practices is also increasing demand for convenient alternatives that can support dietary sodium management across different consumer groups.
Increasing consumer health awareness driving shift toward reduced salt dietary consumption
Greater awareness of the relationship between excessive sodium intake and long-term health is influencing consumers to reassess their dietary choices, thereby supporting the reduced salt food products market. Health-conscious shoppers are paying closer attention to nutritional information and increasingly favoring products positioned around balanced and healthier consumption patterns. This behavioral shift is encouraging manufacturers to reduce sodium content across product formulations while improving flavor profiles through herbs, spices, natural flavoring ingredients, and other alternatives that can compensate for lower salt levels. Retail availability of products with clear reduced-sodium positioning is also helping consumers incorporate lower-salt choices into regular household diets without substantially changing their preferred food categories.
Government-led sodium reduction initiatives pushing reformulation of packaged food products
Public health programs focused on lowering population-level sodium consumption are encouraging food producers to reassess formulations and production practices, which will boost reduced salt food products market demand. Government recommendations, dietary guidelines, labeling requirements, and voluntary sodium reduction programs can create greater pressure for packaged food manufacturers to gradually decrease sodium levels in widely consumed products. Such initiatives also promote greater transparency around nutritional composition, allowing consumers to identify products aligned with lower-sodium dietary goals. As manufacturers respond by reformulating processed foods while preserving shelf stability, texture, flavor, and consumer acceptance, demand for ingredients and formulation approaches that enable effective salt reduction is increasing.
| Growth Driver | Impact on CAGR | Regulatory Influence | Geographic Relevance | Adoption Rate | Impact Timeline |
|---|---|---|---|---|---|
| Rising chronic disease prevalence accelerating demand for low sodium food alternatives | 3.20% | High | North America, Europe, Asia Pacific | High | Near Term |
| Increasing consumer health awareness driving shift toward reduced salt dietary consumption | 2.70% | High | Global | High | Mid Term |
| Government-led sodium reduction initiatives pushing reformulation of packaged food products | 2.30% | High | Europe, North America | High | Mid Term |
Unlock insights tailored to your business with our bespoke market research solutions.
Click to get your customized report now.
Regional Demand Dynamics
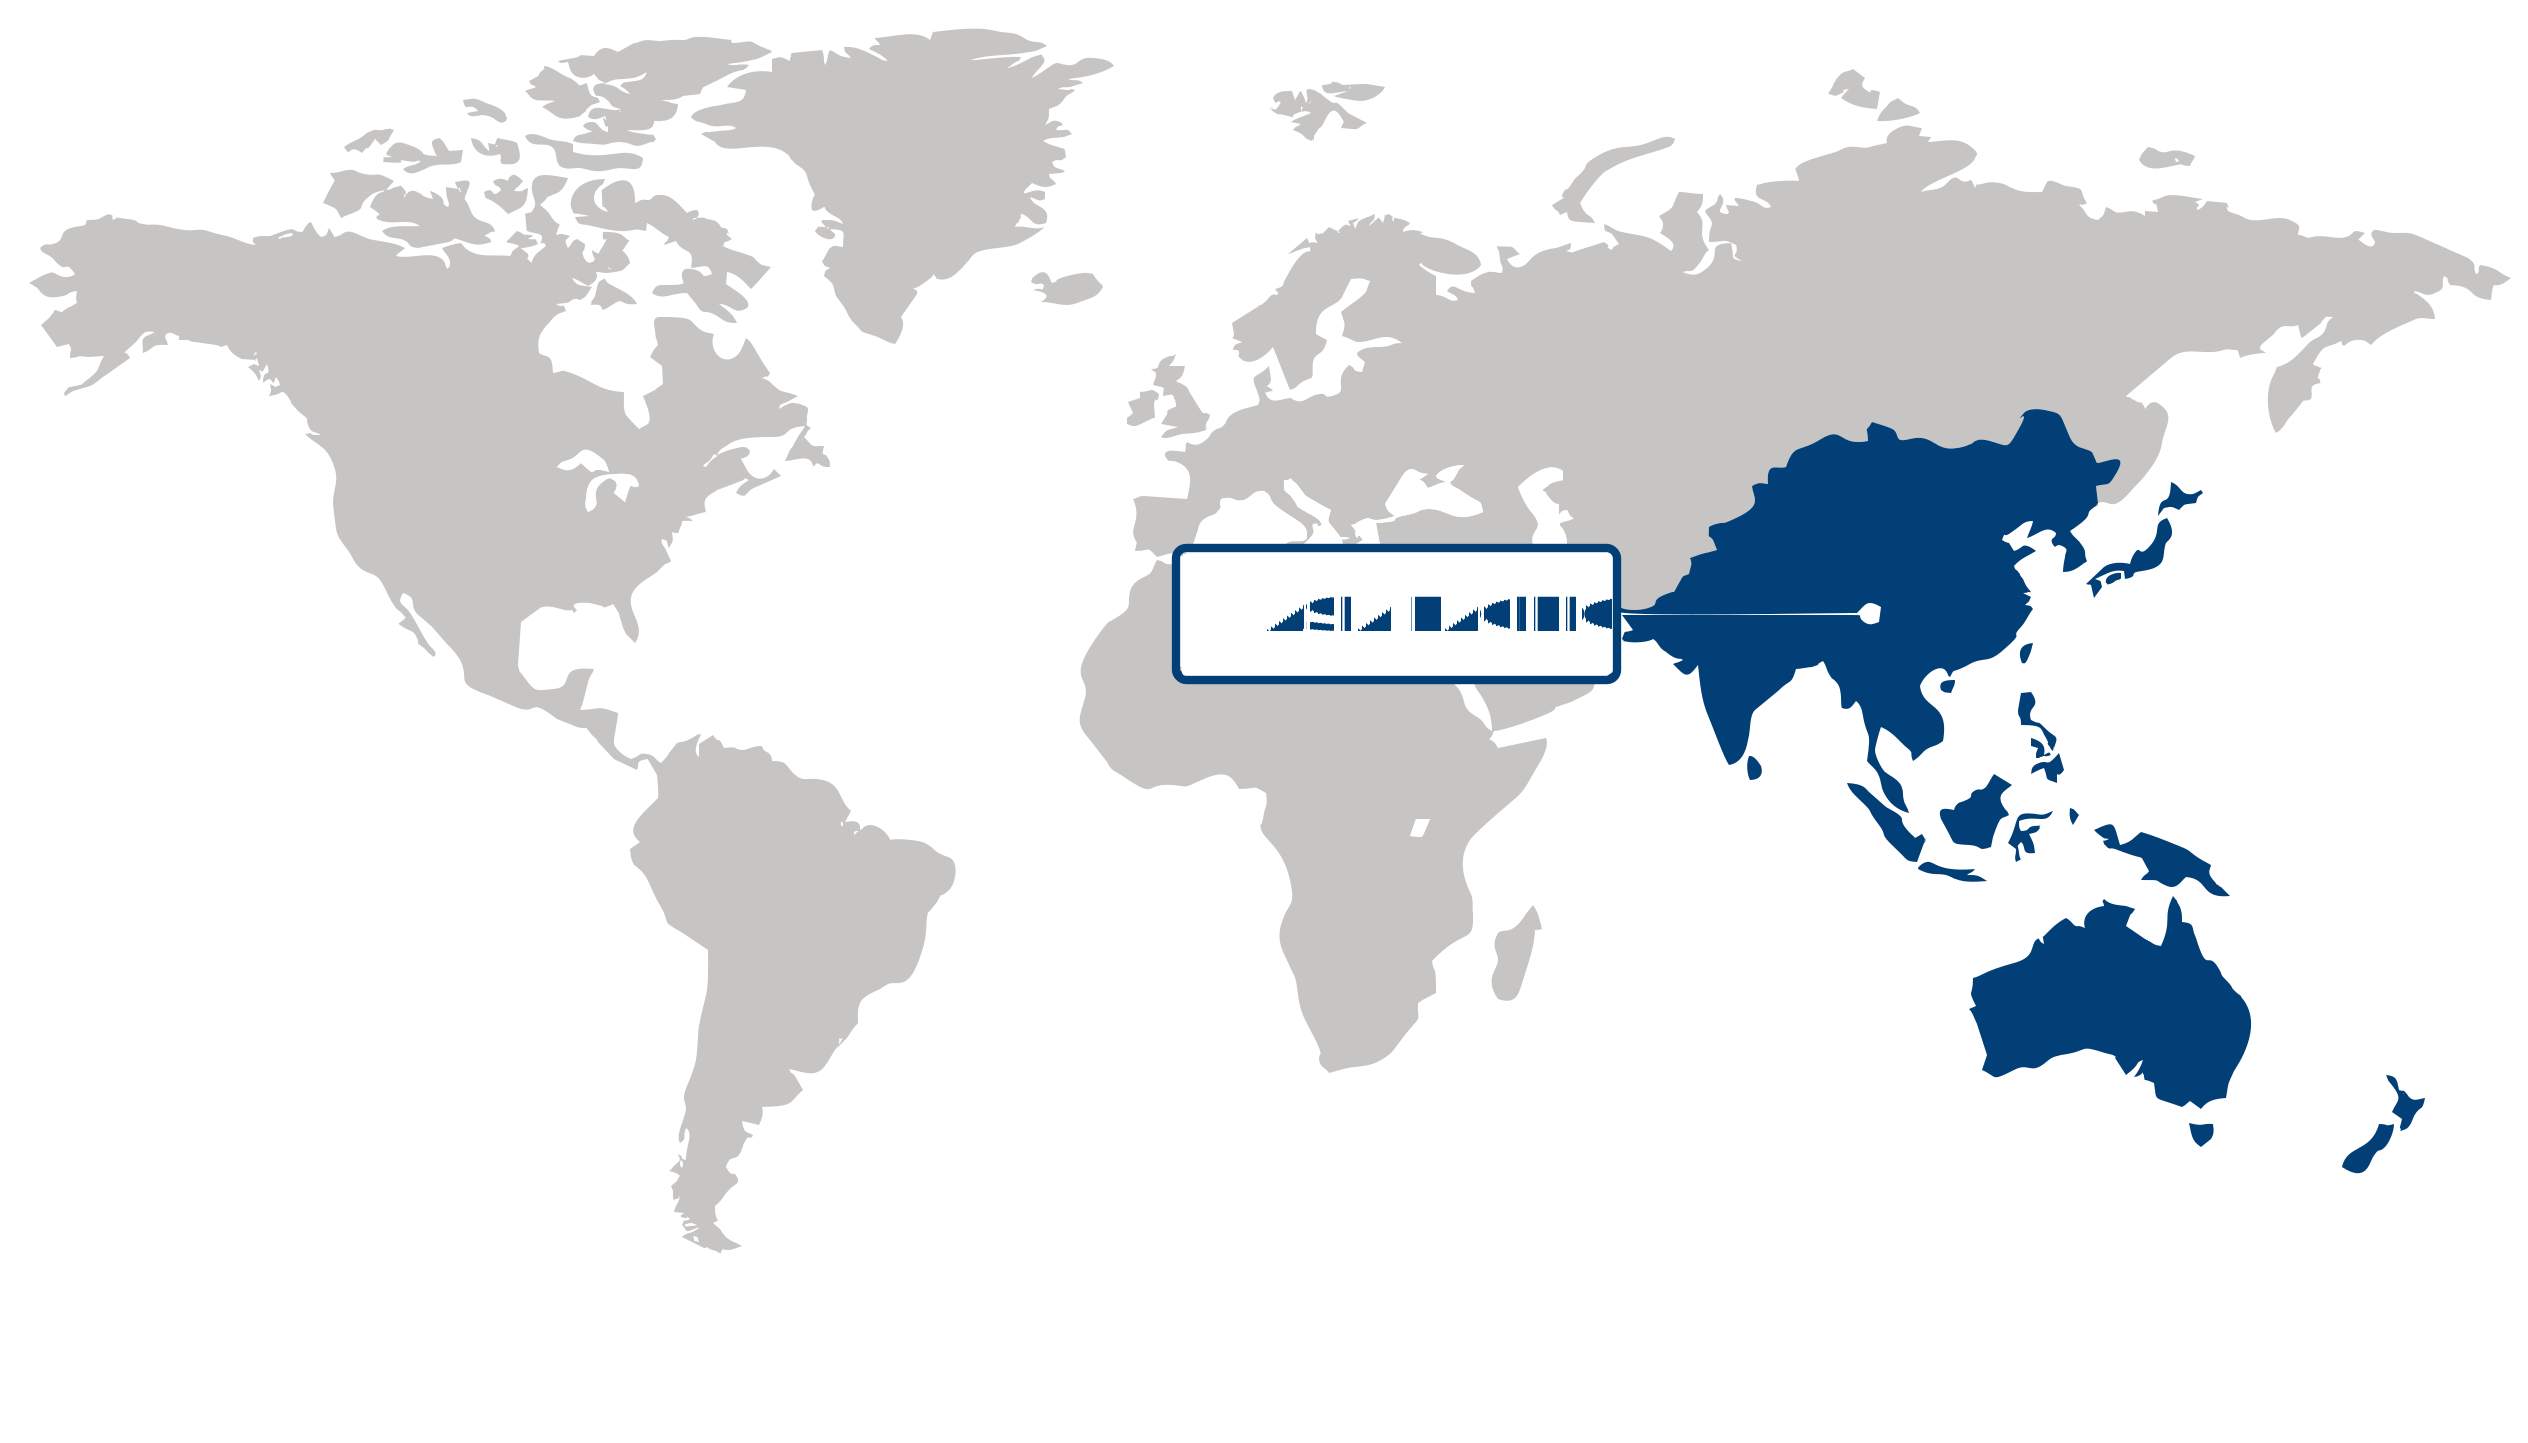
Asia Pacific (Largest Region)
In the reduced salt food products market, Asia Pacific held the largest share of 37.21% in 2026, supported by the region’s large consumer base, rising awareness of diet-related health risks, and growing demand for healthier packaged food options. Public health initiatives aimed at reducing sodium intake are encouraging consumers and food manufacturers to pay greater attention to salt content across processed and convenience foods. Urbanization and changing dietary habits are also increasing demand for reformulated products that balance familiar taste with improved nutritional profiles. In addition, expanding food processing capabilities and broader availability of health-oriented products across retail and foodservice channels are strengthening regional adoption.
North America (Fastest-Growing Region)
North America is positioned as the fastest-growing region, driven by increasing consumer interest in preventive health, clean-label nutrition, and products formulated to support healthier lifestyles. Greater attention to cardiovascular health and sodium consumption is encouraging households to seek lower-sodium alternatives across everyday food categories. Food manufacturers are responding through product reformulation, flavor innovation, and greater emphasis on nutritional transparency, while retailers are expanding the visibility of health-focused offerings. The region’s established packaged food industry, strong consumer awareness, and continued innovation in functional and better-for-you foods are expected to support sustained market expansion.
| Parameter | North America | Asia Pacific | Europe | Latin America | MEA |
|---|---|---|---|---|---|
| Innovation Hub i Scale Nascent Developing Advanced | |||||
| Cost-Sensitive Region i Scale Low Medium High | |||||
| Regulatory Environment i Scale Restrictive Neutral Supportive | |||||
| Demand Drivers i Scale Weak Moderate Strong | |||||
| Development Stage i Scale Emerging Developing Developed | |||||
| Adoption Rate i Scale Low Medium High | |||||
| New Entrants / Startups i Scale Sparse Moderate Dense | |||||
| Macro Indicators i Scale Weak Stable Strong |
Key Country Insights
Germany 🇩🇪
Nutritional Product OptimizationGermany encourages reduced salt food development through continuous product reformulation and transparent nutritional labeling. German food companies focus on maintaining flavor quality while adopting ingredient innovations that support healthier dietary choices across multiple food categories.
France 🇫🇷
Clean Label NutritionFrance emphasizes reduced salt food products supported by natural ingredients and premium food quality standards. French manufacturers increasingly reformulate processed foods with balanced flavor profiles while addressing consumer demand for healthier everyday nutrition.
Italy 🇮🇹
Traditional Recipe AdaptationItaly adapts reduced salt food products to preserve authentic culinary characteristics while improving nutritional profiles. Italian food producers increasingly refine recipes with ingredient innovation and gradual sodium reduction strategies that maintain consumer acceptance.
Japan 🇯🇵
Balanced Nutrition FocusJapan prioritizes reduced salt food products that align with nutritional awareness while preserving traditional flavor profiles. Japanese manufacturers increasingly invest in seasoning innovations and processing techniques that deliver satisfying taste with lower sodium content.
South Korea 🇰🇷
Better-for-You InnovationSouth Korea expands reduced salt food offerings across packaged meals, sauces, and convenience products. Companies in South Korea continue developing flavor-enhancing technologies that help reduce sodium while meeting consumer expectations for familiar taste experiences.
United States 🇺🇸
Health-Oriented ReformulationThe U.S. reduced salt food products market is shaped by consumer demand for healthier packaged foods without sacrificing taste. Food manufacturers in the U.S. increasingly reformulate products using alternative flavor technologies and clean-label ingredients to support sodium reduction initiatives.
Segment Leadership and Growth Trends
Reduced Salt Food Products Market Share (%), by Distribution Channel, 2026
Go beyond the chart, access full insights & data tables
Request Free Sample ReportDistribution Channel Segment Analysis: Offline (Largest Segment) vs Online (Fastest-Growing Segment)
In the reduced salt food products market, the offline segment accounted for the largest share of 75.84% in 2026, reflecting the continued importance of supermarkets, hypermarkets, grocery stores, and other physical retail outlets for packaged food purchases. Consumers benefit from immediate product availability and the ability to compare nutritional labels directly at the point of purchase. Strong retailer networks and the established shopping habits associated with everyday food products further support offline distribution, particularly for consumers seeking convenient access to familiar reduced-salt alternatives.
Online distribution is emerging as the fastest-growing channel as consumers increasingly use digital platforms to discover and purchase health-oriented food products. E-commerce provides broader product visibility, convenient home delivery, and easier comparison of nutritional attributes, which can encourage trial of reduced-salt offerings. The expansion of online grocery services and direct-to-consumer selling is also enabling manufacturers to reach health-conscious consumers beyond traditional retail networks.
Product Type Segment Analysis: Snacks (Largest & Fastest-Growing Segment)
The snacks segment dominated the reduced salt food products market, accounting for a 56.44% share in 2026, while also representing the fastest-growing product category. Its strong position reflects the high frequency of snack consumption and increasing consumer attention to healthier formulations without eliminating convenient, ready-to-eat options. Manufacturers are responding through reduced-sodium recipes, reformulated ingredients, and expanded choices across savory snack categories. The combination of convenience, portability, and growing demand for better-for-you alternatives is supporting continued adoption of reduced-salt snacks across retail and foodservice channels.
| Segment | Sub-Segment | Largest Segment | Fastest Growing |
|---|---|---|---|
| Distribution Channel | Offline, Online | Offline | Online |
| Product Type | Snacks, Meat, Poultry, & Seafood, Others | Snacks | Snacks |
Competitive Landscape and Market Positioning
Major players in the reduced salt food products market:
1. Nestlé S.A. (Switzerland)
2. PepsiCo Inc. (United States)
3. General Mills Inc. (United States)
4. Kellogg Company (United States)
5. The Kraft Heinz Company (United States)
6. Conagra Brands Inc. (United States)
7. Tyson Foods Inc. (United States)
8. Hormel Foods Corporation (United States)
9. Maple Leaf Foods Inc. (Canada)
10. Smithfield Foods Inc. (United States)
The reduced salt food products market is being driven by rising health awareness and shifting dietary preferences toward lower sodium intake. Innovation in formulation techniques is enabling improved taste retention while reducing salt content. Regulatory emphasis on nutritional labeling is also influencing product development strategies. In the reduced salt food products market, sustained R&D efforts are central to balancing health requirements with sensory appeal.
| Company | Market Share | Company Revenue | Revenue CAGR (%) | Product Portfolio | Geographic Presence | Innovation / R&D Focus | Strategic Developments |
|---|---|---|---|---|---|---|---|
| Nestlé S.A. (Switzerland) | |||||||
| PepsiCo Inc. (United States) | |||||||
| General Mills Inc. (United States) | |||||||
| Kellogg Company (United States) | |||||||
| The Kraft Heinz Company (United States) | |||||||
| Conagra Brands Inc. (United States) | |||||||
| Tyson Foods Inc. (United States) | |||||||
| Hormel Foods Corporation (United States) | |||||||
| Maple Leaf Foods Inc. (Canada) | |||||||
| Smithfield Foods Inc. (United States). |
Industry Development/News
| Company Name | Date | Key Development |
|---|
Customize Your Report
Explore examples of how this report can be tailored to different research needs, including custom segments, additional topics or chapters, and related reports. Click a section of the wheel or its numbered marker to explore the available options.
Reduced Salt Food Products Market — Custom Segments
| Segment | Sub-Segment |
|---|---|
| End User | Retail Consumers, Foodservice Operators, Institutional Buyers |
| Packaging Format | Pouches & Bags, Cans & Tins, Bottles & Jars, Trays & Boxes |
| Price Tier | Economy, Mid-Range, Premium |
Reduced Salt Food Products Market — Custom TOC
| Custom Chapter | Custom Details |
|---|---|
| Sodium Reduction Reformulation Strategies |
|
| Retail Assortment and Private Label Benchmarking |
|
| Health Claims and Front-of-Pack Labeling Strategy |
|
Need a different cut of the data?
Request Custom ResearchHow big is the reduced salt food products market?
How is the reduced salt food products industry expected to grow over the next 10 years?
How are government sodium reduction initiatives influencing product development in the reduced salt food products market?
Why is consumer health awareness strengthening demand for reduced salt food products?
Why does Offline retail dominate reduced salt food products?
How is Online retail driving growth in reduced salt food products?
Why is Asia Pacific the largest regional market for reduced salt food products?
What is driving North America's growth in the reduced salt food products market?
Who are the major participants shaping the reduced salt food products landscape?
Our Clients
"The report provided a thorough look at market trends, technological advancements, and the competitive landscape. The depth of insights was really valuable."
ITC Limited
"We would highly recommend Fundamental Business Insights & Consulting to anyone looking for reliable, detailed, and comprehensive market research in the Food industry."
Tyson Foods
"The clarity and presentation of the information were commendable. The report was delivered timely, which made the overall experience smooth and convenient."
Mondelēz International
Our Research Team & Methodology
Every Fundamental Business Insights report is built by a dedicated vertical research team, validated through a structured primary-and-secondary methodology, and reviewed for accuracy before it reaches you.
Research Team Overview
Prepared by the Food & Beverage Research Team
Delivery
Published
Demand
Available
Support
Trust & Compliance
Research Domains
10 coverage areasResearch Intelligence
| Source | Reference |
|---|---|
| Food and Agriculture Organization (FAO) | www.fao.org |
| World Health Organization (WHO) | www.who.int |
| U.S. Food & Drug Administration (FDA) | www.fda.gov |
| European Food Safety Authority (EFSA) | www.efsa.europa.eu |
| U.S. Department of Agriculture (USDA) | www.usda.gov |
| Codex Alimentarius Commission | www.fao.org/fao-who-codexalimentarius |
| International Organization for Standardization (ISO) | www.iso.org |
| AOAC INTERNATIONAL | www.aoac.org |
| Institute of Food Technologists (IFT) | www.ift.org |
| International Dairy Foods Association (IDFA) | www.idfa.org |
| International Sweeteners Association (ISA) | www.sweeteners.org |
| International Probiotics Association (IPA) | internationalprobiotics.org |
| Good Food Institute (GFI) | gfi.org |
| American Feed Industry Association (AFIA) | www.afia.org |
| International Feed Industry Federation (IFIF) | ifif.org |
| Specialty Food Association (SFA) | www.specialtyfood.com |
| Brewers Association | www.brewersassociation.org |
| International Bottled Water Association (IBWA) | bottledwater.org |
| International Alliance for Dietary/Food Supplement Associations (IADSA) | www.iadsa.org |
| OECD Agriculture & Food | www.oecd.org/agriculture |
Research Workflow & Quality Assurance
Data Collection
Verified information gathered through primary and secondary research.
Data Triangulation
Cross-validation using multiple independent data sources.
Forecast Modelling
Market estimates developed using historical trends and analytical models.
Analyst Validation
Findings reviewed by domain experts for accuracy and consistency.
Editorial & Quality Review
Final editorial, quality, and compliance checks before publication.
Final Publication
Released after successful completion of the internal review process.
Report Coverage
📊 Market Assessment
- Market Size & Forecast
- Market Segmentation
- Regional Analysis
- Growth Drivers & Challenges
- Market Dynamics
🏢 Competitive Intelligence
- Competitive Landscape
- Company Profiles
- Competitive Benchmarking
- Mergers & Acquisitions
- Market Share Analysis or Key Company Strategies
🔍 Strategic Analysis
- Value Chain Analysis
- Porter's Five Forces
- PESTLE Analysis
- Pricing Trends
- Supply-Demand Analysis
🚀 Future Outlook
- Technology Landscape
- Regulatory Landscape
- Investment & Funding Landscape
- Emerging Opportunities
- Future Market Outlook
Have a question about this report or need a custom scope?
Request Customization