Plastic Recycling Market Size & Forecasts 2026-2035, By Segments (Recycling Process, Material, Application), Growth Opportunities, Innovation Landscape, Regulatory Shifts, Strategic Regional Insights (U.S., Japan, China, South Korea, UK, Germany, France), and Competitive Dynamics (Veolia, Suez, Waste Management, Republic Services, Clean Harbors)
Market Size and Growth Outlook
Plastic Recycling Market size is anticipated to rise from USD 53.57 billion in 2025 to USD 80.06 billion by 2035, reflecting a CAGR surpassing 4.1% over the forecast horizon of 2026-2035. The estimated revenue for 2026 is USD 55.45 billion.
Get more details on this report
Request Free Sample ReportPlastic Recycling Market Intelligence Snapshot
Regional Market Dynamics
Segment Momentum
Market Expansion Drivers
Leading Market Participants
Global Market Forecast Snapshot
Market Outlook
Regional and Segment Outlook
Market Growth Drivers and Industry Trends
Rising regulatory pressure and corporate commitments are reshaping demand and supply dynamics in the plastic recycling market: the European Commission’s Single-Use Plastics Directive and expanding Extended Producer Responsibility schemes, UNEP’s circular economy advocacy, and brand programs such as Coca-Cola’s World Without Waste and Unilever’s packaging commitments create clear obligations and brand-driven demand for recycled content. Established recyclers can leverage long-term offtake agreements and compliance services, while new entrants can capture value through EPR compliance platforms, collection innovations, and traceability solutions. Near-term momentum from enacted laws and public corporate targets suggests a predictable increase in demand for verified recycled feedstock and higher-quality collection systems.
Expansion of Recycling Infrastructure in Emerging Markets
Public finance and private investment are closing collection and processing gaps that have constrained supply in many regions: the Asian Development Bank and World Bank are funding municipal waste projects and the Government of India’s urban waste programs are accelerating formalization of collection, while operators such as Veolia and Indorama Ventures are expanding facilities and partnerships across Asia and Africa. This buildout expands feedstock availability in the plastic recycling market and creates strategic openings for incumbents to scale via public–private partnerships and for micro-entrepreneurs or franchised collection networks to establish local supply chains. Observable increases in multilateral funding and corporate sourcing commitments are converting pilot schemes into operational networks.
Development of Advanced Recycling Technologies
Breakthroughs in chemical and enzymatic approaches are widening acceptable feedstock and end‑use applications: Carbios’ enzymatic PET trials, Eastman’s molecular recycling investments, Plastic Energy’s pyrolysis plants and research programs involving ExxonMobil illustrate technology-driven pathway diversification. These advances increase the value capture potential across the plastic recycling market by enabling hard-to-recycle streams to be converted into near‑virgin polymers. Incumbents can capture margin by integrating or licensing technologies and securing feedstock; new entrants can specialize in technology deployment, feedstock aggregation, or brand partnerships for certified recycled polymers. The recent commissioning of industrial-scale facilities indicates a transition from pilot to commercial operations.
Industry Restraints:
Feedstock Contamination and Sorting Limitations
Contaminated, heterogenous waste streams sharply reduce yield and raise processing costs because mixed polymers, food residues, and multilayer packaging require advanced sorting and washing to meet quality specs; this slows scale-up of mechanical and chemical recycling. The U.S. Environmental Protection Agency (EPA) has documented operational challenges tied to contamination in municipal recycling systems, and the Ministry of Ecology and Environment of the People’s Republic of China’s 2018 restrictions on solid waste imports (National Sword) exposed global reliance on low-quality exports. Strategically, incumbents must invest in optical sorters, near‑infrared technology and preprocessing to protect margins, while new entrants face higher capital intensity and inconsistent feedstock availability. Expect continued emphasis on upstream collection upgrades and enforcement of import/export quality standards in the near to medium term.
Virgin Resin Price Advantage and Margin Pressure
Persistent low feedstock costs for petrochemical producers compress the price competitiveness of recycled polymers, limiting commercial uptake of recyclates where price-sensitive buyers dominate. The International Energy Agency (IEA) has highlighted oil and gas price volatility as a determinant of petrochemical feedstock economics, and S&P Global analyses have linked periods of low naphtha/ethane prices to depressed virgin resin pricing; major producers such as Dow Inc. and ExxonMobil Chemical have publicly noted advantaged feedstock positions in investor materials. For recyclers and brand owners this creates margin pressure and slows contractual adoption of recycled content, advantaging integrated petrochemical incumbents over standalone recyclers and startups. Absent stronger policy levers or sustained premium for certified recyclates, this dynamic will continue to constrain commercialization through the medium term.
| Growth Driver | Impact on CAGR | Regulatory Influence | Geographic Relevance | Adoption Rate | Impact Timeline |
|---|---|---|---|---|---|
| Increasing Awareness and Policies for Plastic Recycling | 1.50% | Short term (≤ 2 yrs) | Europe, North America | High | Fast |
| Expansion of Recycling Infrastructure in Emerging Markets | 1.30% | Medium term (2–5 yrs) | Asia Pacific, Latin America | Medium | Moderate |
| Development of Advanced Recycling Technologies | 1.30% | Long term (5+ yrs) | Europe, Asia Pacific | Medium | Moderate |
Explore Growth Opportunities
Request Free Sample ReportRegional Demand Dynamics
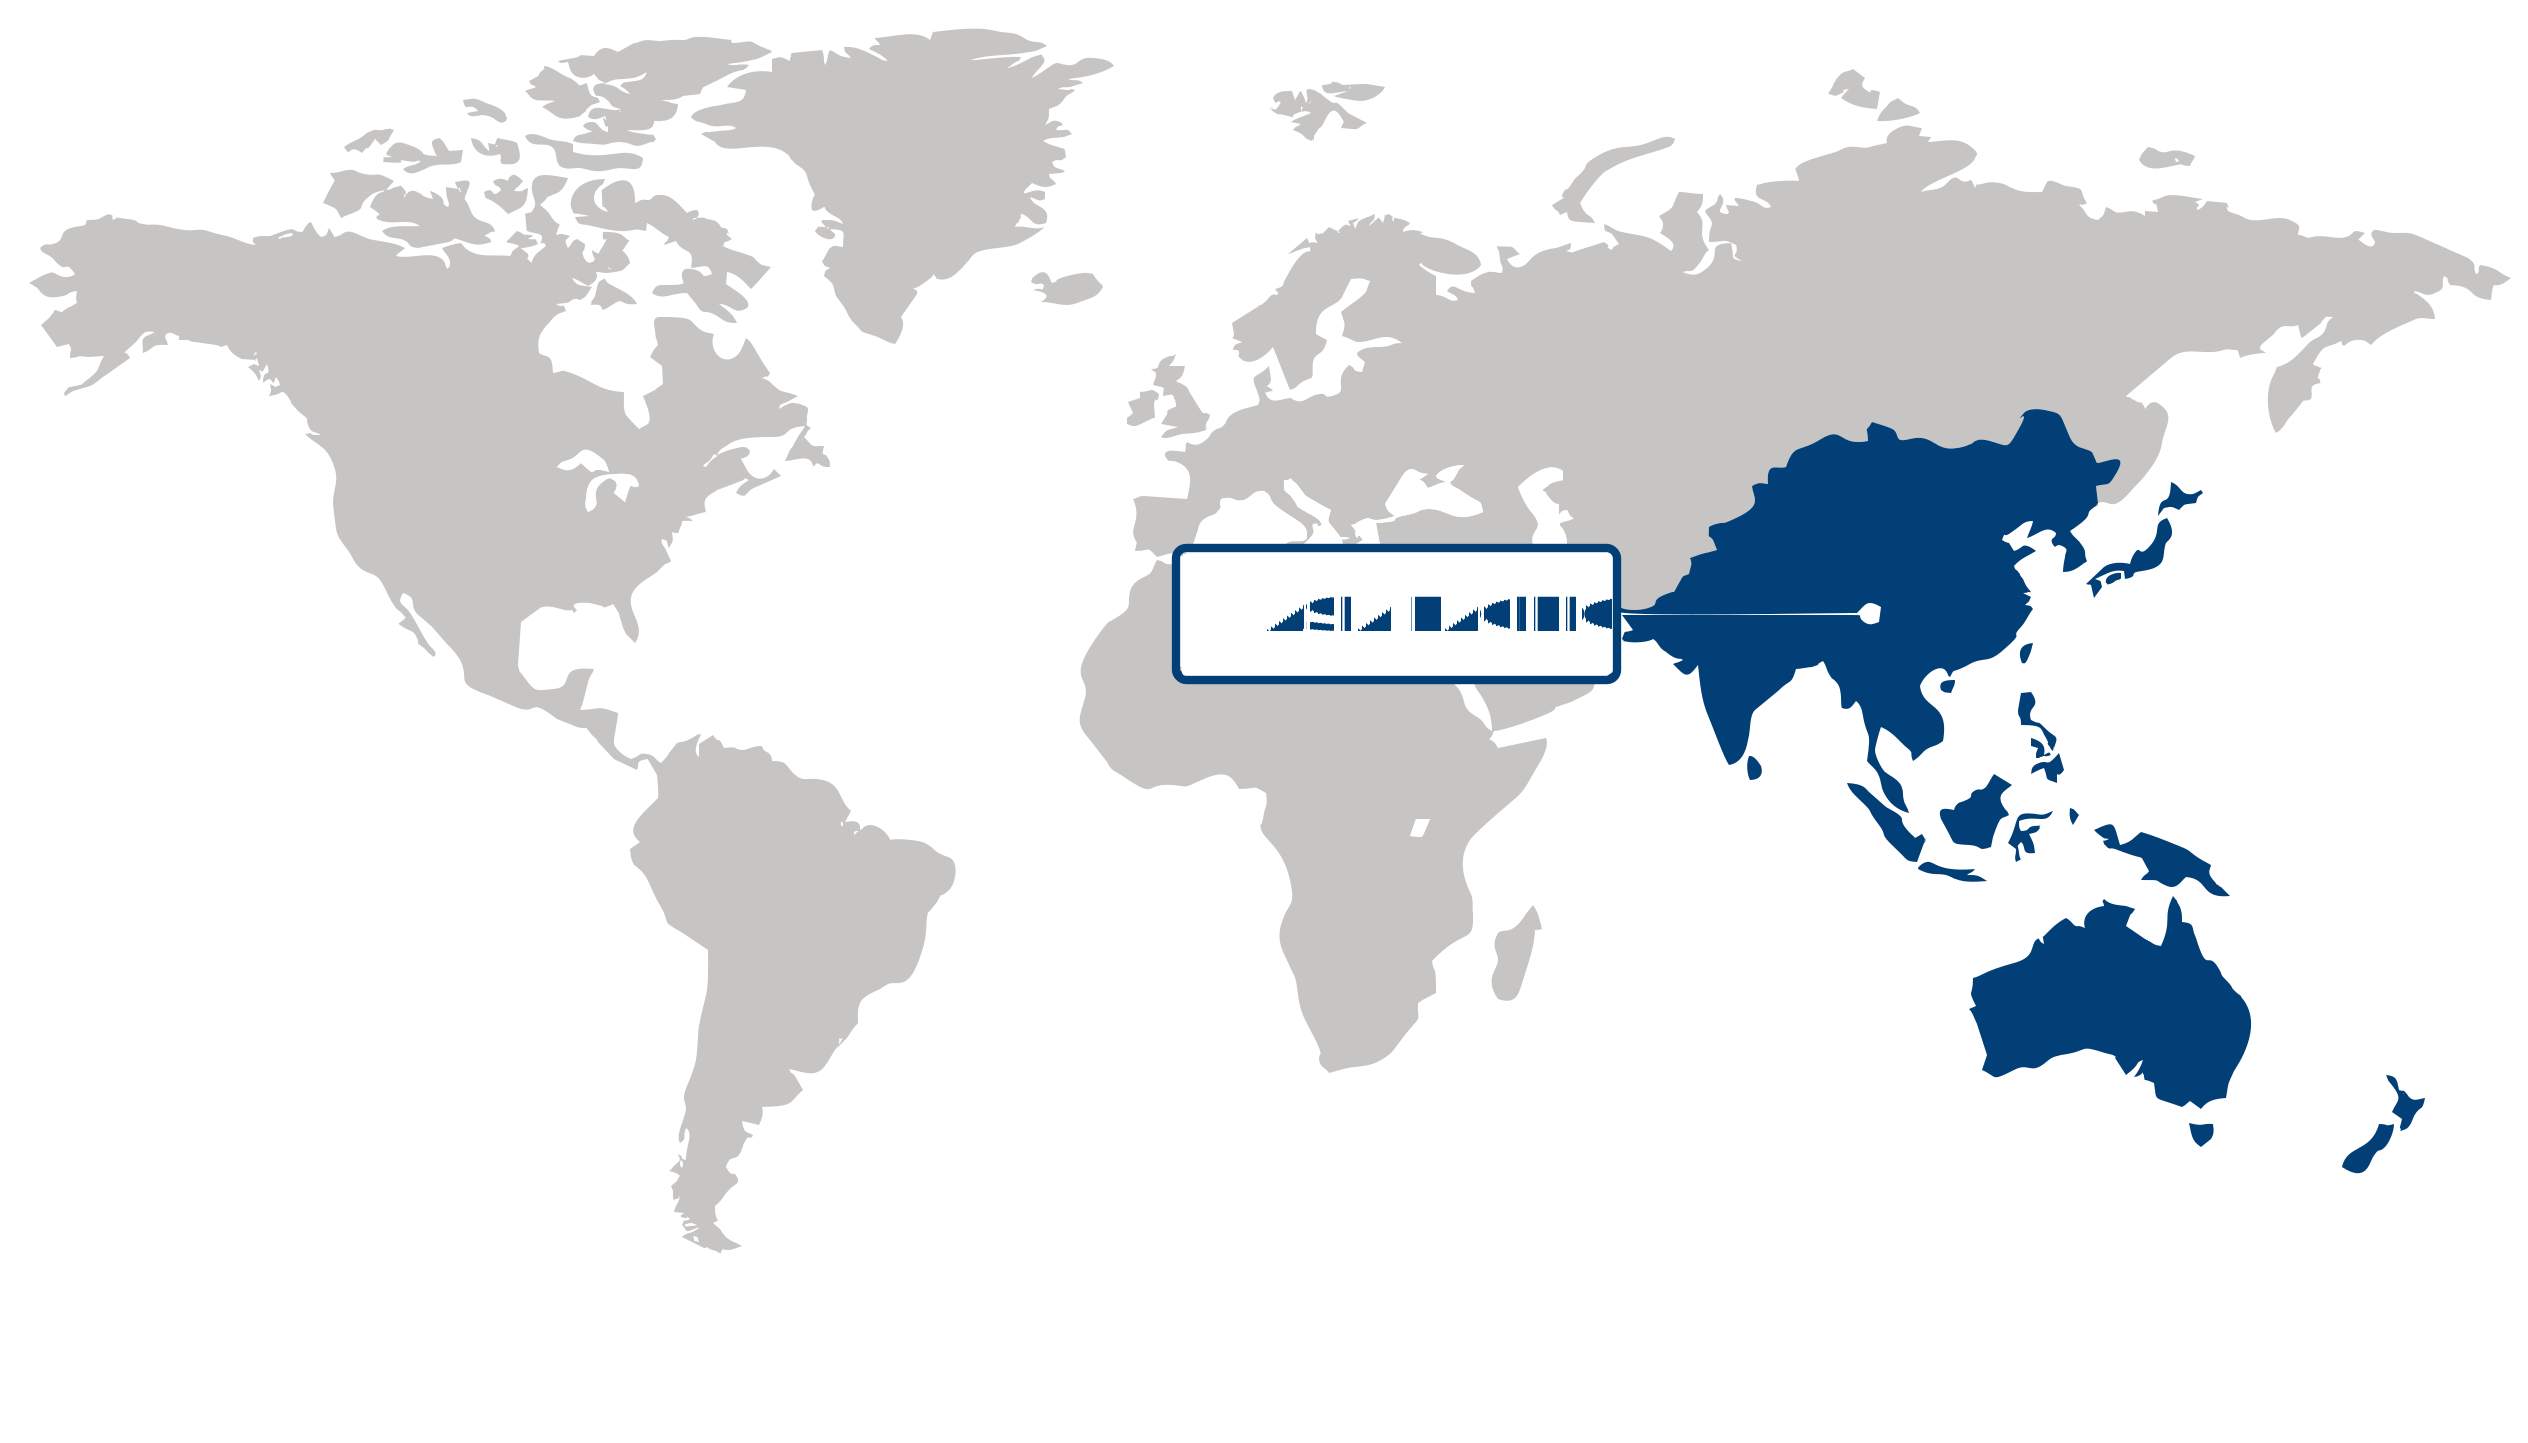
The plastic recycling market in Asia Pacific captured over 60.6% of the global market in 2025, making the region the largest by share. This leadership is driven by accelerating regulatory pressure and rapidly growing demand for recycled content in manufacturing and packaging, as seen in policy shifts from the Ministry of Ecology and Environment of the People’s Republic of China and Japan’s Plastic Resource Circulation Strategy from the Ministry of the Environment, Japan. Infrastructure investments by firms such as Indorama Ventures and Veolia, combined with Asian Development Bank and World Bank analyses highlighting rising packaging waste and container demand, reinforce capacity growth. Given these coordinated policy, demand, and investment signals, Asia Pacific offers sustained, large-scale opportunities across collection, mechanical and chemical recycling, and integrated supply-chain partnerships.
Japan is positioned as a pivotal hub in Asia Pacific; the plastic recycling market in Japan benefits from advanced domestic policy frameworks and high-value technology adoption. Japan’s Ministry of the Environment has pushed the Plastic Resource Circulation Strategy and industry players such as JFE Engineering have announced technology deployments for chemical recycling and improved sorting, while leading manufacturers pursue closed-loop sourcing. Urban collection systems and consumer willingness to pay for recycled content support premium rPET and high-purity feedstock projects, suggesting opportunities for technology licensors and brand partnerships targeting quality-focused recycled outputs.
China anchors the region’s production and collection capacity; the plastic recycling market in China has scaled rapidly as policy tightened on waste imports and prioritized domestic recycling through the Ministry of Ecology and Environment of the People’s Republic of China. Large-scale collection networks and commodity-scale processing attract investments from both domestic and multinational firms, and brand commitments—such as those by The Coca-Cola Company to increase rPET use in China—are expanding demand for feedstock. Strategic implications include prioritizing investments in sorting and industrial chemical recycling plants and partnering with consumer goods firms to secure long-term offtake in the region.
Europe Market Analysis:
Europe emerged as the fastest-growing region in the plastic recycling market, posting a CAGR of 5.74% as regulatory momentum—notably the EU Circular Economy Action Plan and strengthened Packaging and Packaging Waste Directive—accelerates collection, sorting, and recycling investments. The market growth is propelled by strong regulatory focus on circular economy and implementation of Extended Producer Responsibility (EPR) in Europe, prompting manufacturers and compliance schemes to fund infrastructure upgrades; the European Commission’s EPR guidance and Plastics Recyclers Europe advocacy have catalyzed capacity expansions. The European Investment Bank and major players such as Veolia and SUEZ have signaled financing and asset deployment to meet higher recycled-content mandates. Given coordinated policy, rising corporate procurement of recyclates, and available project finance, Europe offers sizable deployment opportunities in advanced sorting, chemical recycling pilots, and integration of recycled feedstocks into supply chains.
Germany anchors the Europe plastic recycling market with high municipal collection rates, industrial-scale sorting networks, and the Packaging Act (VerpackG) that strengthens EPR compliance. German recyclers such as ALBA Group and REMONDIS have expanded mechanical recycling lines and partnerships with manufacturers to deliver certified recyclates, while the Umweltbundesamt highlights strong domestic recycling throughput and nuanced municipal systems. Demand from automotive and packaging manufacturers for higher-quality PCR has driven investments in nearshore capacities and digital tracking pilots. Strategic implication: Germany’s robust infrastructure and regulatory clarity make it a launchpad for scale-up of technologies and commercial offtake agreements that can supply recycled content across Europe.
France plays a leading adopter role in the Europe plastic recycling market through Loi AGEC measures, active compliance schemes like CITEO, and aggressive targets for packaging recyclability. French recyclers such as PAPREC and multinational operators including Veolia have announced capacity projects and partnerships to meet national targets, while French regulators and CITEO coordinate extended producer responsibility fees to incentivize redesign and collection. Pilot initiatives for deposit-return systems and municipal modernization have elevated consumer sorting rates and created procurement pipelines for recyclates. Strategic implication: France’s policy-driven demand signal and organized compliance ecosystem create commercially attractive conditions for investments in advanced recycling and product-to-product supply chains that reinforce regional capacity needs.
North America Market Trends:
North America experienced lucrative growth in the plastic recycling market, driven by coordinated policy signals, rising corporate sustainability commitments, and a surge of private capital targeting infrastructure modernization. Governments and regulators have tightened expectations—Environment and Climate Change Canada’s single‑use plastics actions and the U.S. Environmental Protection Agency’s National Recycling Strategy provide recent policy anchors—while investors such as Closed Loop Partners have announced funds for materials recovery infrastructure. Industry initiatives from The Coca‑Cola Company’s World Without Waste and The Recycling Partnership’s municipal grants illustrate demand‑side and collection improvements. These combined dynamics, alongside improvements in cross‑border logistics and growing consumer preferences for recycled content, position the region for expanded investment and scalable circular solutions over the next investment cycle.
The U.S. serves as the dominant hub in the plastic recycling market, concentrating capital deployment, advanced sorting and processing adoption, and large secondary resin volumes. U.S. activity is exemplified by the EPA’s National Recycling Strategy framing federal coordination, Closed Loop Partners’ infrastructure investments in American materials recovery facilities, and technology rollouts by AMP Robotics in U.S. material recovery facilities that raise throughput and purity. The Recycling Partnership’s local grant programs and commentary from the Institute of Scrap Recycling Industries underscore operational and workforce pressures that create opportunities for automation and service models. Strategically, U.S. leadership in technology and scale creates exportable operating models and investment pipelines that can accelerate North American recycling capacity.
| Parameter | North America | Asia Pacific | Europe | Latin America | MEA |
|---|---|---|---|---|---|
| Innovation Hub i Scale Nascent Developing Advanced | |||||
| Cost-Sensitive Region i Scale Low Medium High | |||||
| Regulatory Environment i Scale Restrictive Neutral Supportive | |||||
| Demand Drivers i Scale Weak Moderate Strong | |||||
| Development Stage i Scale Emerging Developing Developed | |||||
| Adoption Rate i Scale Low Medium High | |||||
| New Entrants / Startups i Scale Sparse Moderate Dense | |||||
| Macro Indicators i Scale Weak Stable Strong |
Segment Leadership and Growth Trends
Plastic Recycling Market Share (%), by Recycling Process, 2026
Go beyond the chart, access full insights & data tables
Request Free Sample ReportMechanical dominated the plastic recycling market in 2025, holding the largest share as growth is impelled by the widespread availability of established mechanical recycling infrastructure. This leadership reflects long-standing investments by operators such as Veolia, Waste Management, and SUEZ in collection, sorting and extrusion lines and the proliferation of advanced optical sorting from Tomra, enabling consistent feedstock quality and lower processing costs. Consumer demand for lower-carbon packaging, regulatory recycling targets from the European Commission, and municipal feedstock consolidation have reinforced scale advantages. The segment offers strategic value for incumbents through capacity optimization and for entrants via niche services (e.g., retrofit sorting, feedstock aggregation), and it should remain central near term as infrastructure upgrades and digital sorting continue to lower costs and improve yields.
Analysis by Material
Polyethylene Terephthalate represented largest share in the plastic recycling market in 2025, propelled by high collection rates and strong demand for recycled PET in packaging. Brand commitments from The Coca‑Cola Company, PepsiCo, Nestlé and Unilever to increase rPET use, together with collection schemes in Europe and deposit-return systems cited by the European Commission, have tightened demand for post-consumer PET. Improvements in bottle-to-bottle mechanical recycling and quality controls adopted by major recyclers underpin market leadership, while consumer preference for recyclable packaging and retailer sourcing policies amplify uptake. Opportunities exist for integrated players to secure feedstock and for innovators to improve contaminant removal, and the segment is likely to stay relevant as corporate recycled-content targets and regulatory mandates persist.
Analysis by Application
Packaging held largest share in the plastic recycling market in 2025, supported by increasing regulatory pressure for sustainable packaging materials. Policies from the European Commission and sustainability commitments from brand owners such as The Coca‑Cola Company and Unilever have driven demand for recycled-content packaging and stimulated supply-chain partnerships between recyclers, converters and retailers like Walmart. Shifts in consumer preferences toward circular packaging, greater traceability via digital tagging, and standards from organizations such as the Ellen MacArthur Foundation have encouraged design-for-recycling and higher uptake of recycled polymers. This creates strategic openings for large converters to offer compliant solutions and for startups to commercialize novel recycling-compatible materials; packaging’s centrality is expected to endure as regulatory and brand targets tighten in the near to medium term.
| Segment | Sub-Segment | Largest Segment | Fastest Growing |
|---|---|---|---|
| Recycling Process | Chemical, Mechanical | ||
| Material | Polyethylene Terephthalate, Polypropylene, High-Density Polyethylene, Low-Density Polyethylene | ||
| Application | Packaging, Automotive, Construction, Textile, Others |
Unlock insights tailored to your business with our bespoke market research solutions.
Click to get your customized report now.
Competitive Landscape and Market Positioning
The competitive environment is characterized by intensified moves to secure higher-quality feedstocks and to close loops with downstream resin users. Several incumbents have deepened control over collection networks and introduced higher-precision sorting and traceability systems, while others have extended capabilities toward advanced recycling capacity and integrated feedstock-to-resin collaborations with chemical partners. Technology vendors and recyclers are progressively aligning around pilot deployments of next-generation converters and improved material-preparation processes, reshaping relative positioning by shifting competition from pure volume to feedstock quality, product specification, and reliability of supply for branded end-users.
Strategic / Actionable Recommendations for Regional Players
In North America prioritize closer alignment with large waste-collection networks and consumer-packaging brands to secure consistent, high-purity PET and rigid plastics streams; accelerate deployment of automated optical sorting and digital traceability to meet brand-specification requirements and to differentiate service offerings against scale-focused incumbents.
In Asia Pacific pursue partnerships between petrochemical integrators and local waste processors to build commercially viable circular feedstock corridors; focus investments on scalable film and polyolefin reclamation technologies and low-cost pre-sorting solutions that reflect fragmented collection systems and rapidly evolving industrial demand.
In Europe leverage policy-driven demand for recycled content by deepening cooperation with technology providers and cross-border collection consortia to produce near-virgin-quality recyclates; emphasize upgrades that enable closed-loop supply to consumer goods firms and use regulatory alignment to secure long-term offtake arrangements.
| Company | Market Share | Company Revenue | Revenue CAGR (%) | Product Portfolio | Geographic Presence | Innovation / R&D Focus | Strategic Developments |
|---|---|---|---|---|---|---|---|
| No companies available. | |||||||
Customize Your Report
Explore examples of how this report can be tailored to different research needs, including custom segments, additional topics or chapters, and related reports. Click a section of the wheel or its numbered marker to explore the available options.
Plastic Recycling Market — Custom Segments
| Segment | Sub-Segment |
|---|---|
| No segment data available. | |
Plastic Recycling Market — Custom TOC
| Custom Chapter | Chapter Details | ||
|---|---|---|---|
| No custom TOC data available. | |||
Need a different cut of the data?
Request Custom ResearchHow big is the plastic recycling market?
What is the anticipated CAGR of the plastic recycling industry?
Which geographic area exhibits the highest level of plastic recycling market penetration?
Which region leads in terms of year-over-year growth for the plastic recycling sector?
Why is the mechanical segment leading in the plastic recycling industry?
Why does polyethylene terephthalate sub-segment dominate the material segment of plastic recycling sector?
How much is the packaging segment expected to grow in the plastic recycling industry beyond 2025?
Who are the major participants shaping the plastic recycling landscape?
Our Clients
"The report provided us with a clear direction, and the level of detail was beyond what we expected. I would definitely recommend their services to others."
Haier Appliances
"The collaboration with Fundamental Business Insights has added significant value to our decision-making process, and we look forward to continuing this partnership for our future market research requirements."
Luxottica Group S.p.A.
"The team at FBI delivered an exceptional research report. The insights on industry innovations were particularly impressive and added a lot of value to the overall report."
Nike
Our Research Team & Methodology
Every Fundamental Business Insights report is built by a dedicated vertical research team, validated through a structured primary-and-secondary methodology, and reviewed for accuracy before it reaches you.
Research Team Overview
Prepared by the Consumer Goods & Services Research Team
Delivery
Published
Demand
Available
Support
Trust & Compliance
Research Intelligence
| Source | Reference |
|---|---|
| International Organization for Standardization (ISO) | www.iso.org |
| ASTM International | www.astm.org |
| U.S. Consumer Product Safety Commission (CPSC) | www.cpsc.gov |
| European Commission – Consumer Safety | ec.europa.eu/safety-gate |
| Consumer Technology Association (CTA) | www.cta.tech |
| National Retail Federation (NRF) | nrf.com |
| World Retail Congress | www.worldretailcongress.com |
| World Travel & Tourism Council (WTTC) | wttc.org |
| UN Tourism | www.unwto.org |
| Personal Care Products Council (PCPC) | www.personalcarecouncil.org |
| Cosmetics Europe | cosmeticseurope.eu |
| International Housewares Association (IHA) | www.housewares.org |
| American Apparel & Footwear Association (AAFA) | www.aafaglobal.org |
| World Federation of the Sporting Goods Industry (WFSGI) | wfsgi.org |
| Juvenile Products Manufacturers Association (JPMA) | www.jpma.org |
| Pet Industry Joint Advisory Council (PIJAC) | pijac.org |
| International Council of Toy Industries (ICTI) | www.toy-icti.org |
| International Association of Amusement Parks and Attractions (IAAPA) | iaapa.org |
| Organisation for Economic Co-operation and Development (OECD) | www.oecd.org |
| World Bank Data | data.worldbank.org |
Research Workflow & Quality Assurance
Data Collection
Verified information gathered through primary and secondary research.
Data Triangulation
Cross-validation using multiple independent data sources.
Forecast Modelling
Market estimates developed using historical trends and analytical models.
Analyst Validation
Findings reviewed by domain experts for accuracy and consistency.
Editorial & Quality Review
Final editorial, quality, and compliance checks before publication.
Final Publication
Released after successful completion of the internal review process.
Report Coverage
📊 Market Assessment
- Market Size & Forecast
- Market Segmentation
- Regional Analysis
- Growth Drivers & Challenges
- Market Dynamics
🏢 Competitive Intelligence
- Competitive Landscape
- Company Profiles
- Competitive Benchmarking
- Mergers & Acquisitions
- Market Share Analysis or Key Company Strategies
🔍 Strategic Analysis
- Value Chain Analysis
- Porter's Five Forces
- PESTLE Analysis
- Pricing Trends
- Supply-Demand Analysis
🚀 Future Outlook
- Technology Landscape
- Regulatory Landscape
- Investment & Funding Landscape
- Emerging Opportunities
- Future Market Outlook
Have a question about this report or need a custom scope?
Request Customization