Observability Tools and Platforms Market Size & Growth Forecast 2027–2036, By Segments (Component, Deployment, Organization Size, Vertical), Regional Demand Trends (North America, Asia Pacific, Europe), Key Country Insights (U.S., Japan, South Korea, Germany, France, Italy), and Competitive Landscape
Market Size and Growth Outlook
Observability Tools and Platforms Market size was more than USD 3.5 billion in 2026 and is set to grow at a 10.17% CAGR between 2027 and 2036, exceeding USD 9.22 billion by 2036. The industry revenue for 2027 is assessed at USD 3.8 billion.
Get more details on this report
Request Free Sample ReportObservability Tools and Platforms Market Intelligence Snapshot
Regional Market Dynamics
- North America leads with 40.28% share due to mature cloud-native ecosystems, distributed applications, and strong integration of observability into DevOps and IT operations workflows.
- Growth is driven by rapid cloud adoption, digital transformation, and increasing demand for monitoring complex distributed systems, supporting an 11.98% CAGR over the forecast period.
Segment Momentum
- Solutions accounted for 65.96% of the market in 2026 because organizations prioritize software platforms that unify monitoring, logging, tracing, and performance analysis while improving operational visibility across complex IT environments.
- Cloud is the fastest-growing deployment model because it supports scalable, cloud-native environments with centralized visibility, operational flexibility, and efficient monitoring for expanding digital services and hybrid infrastructures.
Market Expansion Drivers
- Rising cloud-native and microservices adoption increasing demand for real-time observability platforms.
- Growing AI-powered analytics capabilities improving anomaly detection and automated incident response.
- Expansion of DevOps and IoT ecosystems driving continuous monitoring and performance optimization requirements.
Leading Market Participants
- Key companies in the observability tools and platforms market include Dynatrace, Inc. (United States), Splunk Inc. (United States), Microsoft Corporation (United States), International Business Machines Corporation (United States), Broadcom Inc. (United States), Datadog, Inc. (United States), New Relic, Inc. (United States), LogicMonitor, Inc. (United States), ScienceLogic, Inc. (United States), Riverbed Technology LLC (United States).
Global Market Forecast Snapshot
Market Outlook
- 2026 Market Size: USD 3.5 billion
- 2027 Estimated Market Size: USD 3.8 billion.
- Projected Market Size: USD 9.22 billion by 2036
- Growth Forecast: 10.17% CAGR (2027-2036)
Regional and Segment Outlook
- Leading Regional Market: North America
- High-Growth Regional Hub: Asia Pacific
- Core Revenue Segment: Solutions (Component) | Cloud (Deployment) | Large Enterprises (Organization Size) | IT & Telecommunications (Vertical)
- Emerging Opportunity Segment: Services (Component) | Cloud (Deployment) | SMEs (Organization Size) | Retail & E-commerce (Vertical)
Market Growth Drivers and Industry Trends
Rising cloud-native and microservices adoption increasing demand for real-time observability platforms
The transition toward cloud-native architectures and distributed microservices is increasing the complexity of application environments, which will drive the observability tools and platforms market growth. Applications spread across containers, cloud infrastructure, APIs, and interconnected services generate large volumes of telemetry that require continuous analysis to identify performance issues and service dependencies. Real-time observability platforms provide development and operations teams with integrated visibility into logs, metrics, traces, and application behavior, helping them diagnose issues across increasingly distributed technology environments.
Growing AI-powered analytics capabilities improving anomaly detection and automated incident response
The integration of artificial intelligence and machine learning into monitoring systems is enhancing the ability to identify unusual behavior and prioritize operational issues, thereby propelling observability tools and platforms market growth. AI-powered analytics can correlate signals across different infrastructure and application layers, helping distinguish meaningful anomalies from routine fluctuations and reducing the manual effort required for investigation. Automated recommendations and incident-response capabilities can further support faster identification of root causes and improve the coordination of remediation activities.
Expansion of DevOps and IoT ecosystems driving continuous monitoring and performance optimization requirements
The expansion of DevOps practices and connected IoT environments is increasing the need for continuous visibility into software performance, infrastructure health, and device behavior, supporting observability tools and platforms market growth. Frequent software releases require development and operations teams to monitor changes throughout the application lifecycle, while IoT deployments generate diverse telemetry from distributed devices and edge environments. Observability capabilities help organizations correlate operational data, identify performance degradation, and maintain service reliability across rapidly changing digital ecosystems.
| Growth Driver | Impact on CAGR | Regulatory Influence | Geographic Relevance | Adoption Rate | Impact Timeline |
|---|---|---|---|---|---|
| Rising cloud-native and microservices adoption increasing demand for real-time observability platforms | 2.00% | Moderate | North America, Asia Pacific | High | Near Term |
| Growing AI-powered analytics capabilities improving anomaly detection and automated incident response | 1.80% | Moderate | North America, Europe | High | Mid Term |
| Expansion of DevOps and IoT ecosystems driving continuous monitoring and performance optimization requirements | 1.50% | Low | Asia Pacific, Europe | Emerging | Mid Term |
Unlock insights tailored to your business with our bespoke market research solutions.
Click to get your customized report now.
Regional Demand Dynamics
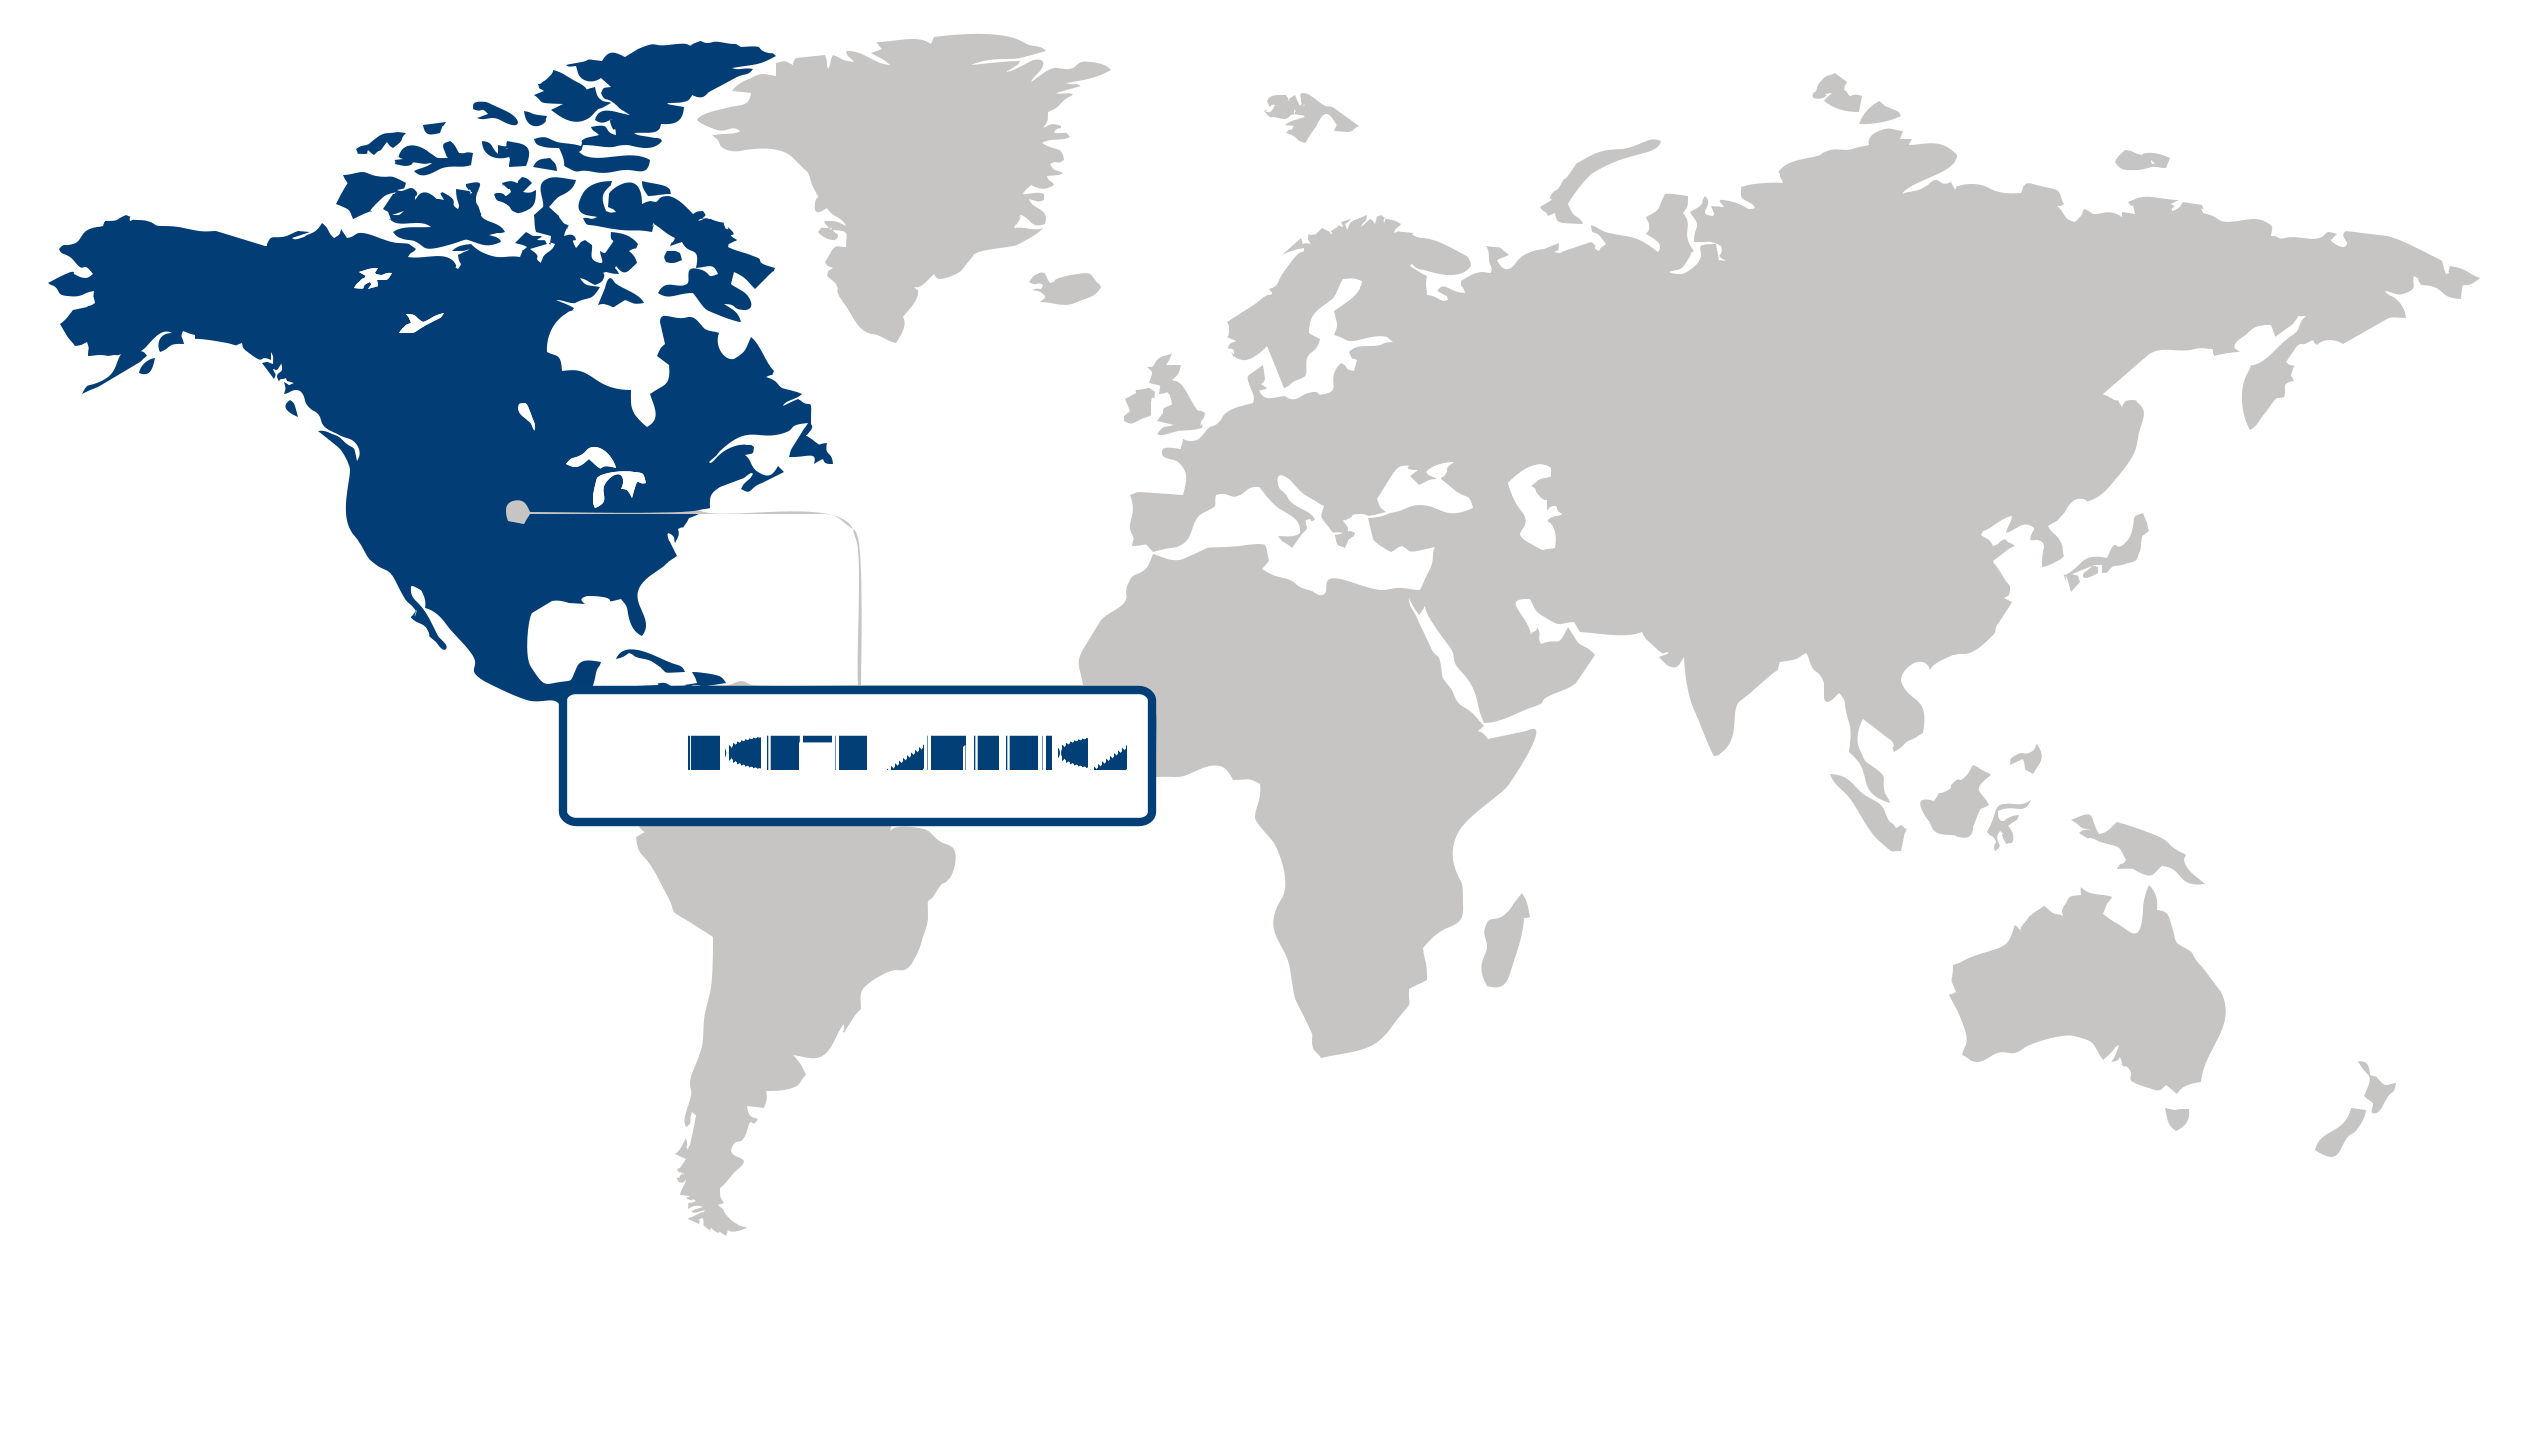
North America (Largest Region)
In the observability tools and platforms market, North America held the largest share of 40.28% in 2026, supported by mature cloud adoption, extensive enterprise technology infrastructure, and strong demand for continuous visibility across increasingly complex digital environments. Organizations across the region are prioritizing application performance, infrastructure monitoring, and rapid incident detection as workloads become more distributed across cloud, hybrid, and microservices-based architectures. The growing emphasis on digital resilience, operational efficiency, and seamless customer experiences is encouraging enterprises to integrate observability capabilities more deeply into IT operations. Strong investment in software modernization and the adoption of automation-driven development practices further support the region's leading position.
Asia Pacific (Fastest-Growing Region)
Asia Pacific is anticipated to be the fastest-growing region, propelled by accelerating digital transformation, expanding cloud infrastructure, and increasing adoption of distributed applications. Enterprises are investing in modern technology environments to improve scalability and service reliability, creating greater demand for tools that provide unified visibility across applications, infrastructure, and digital services. The expansion of e-commerce, financial technology, telecommunications, and other digitally intensive industries is further increasing the need for real-time monitoring and performance management. As organizations modernize legacy systems and adopt cloud-native architectures, observability is becoming increasingly important for maintaining operational continuity and improving technology efficiency across the region.
| Parameter | North America | Asia Pacific | Europe | Latin America | MEA |
|---|---|---|---|---|---|
| Innovation Hub i Scale Nascent Developing Advanced | |||||
| Cost-Sensitive Region i Scale Low Medium High | |||||
| Regulatory Environment i Scale Restrictive Neutral Supportive | |||||
| Demand Drivers i Scale Weak Moderate Strong | |||||
| Development Stage i Scale Emerging Developing Developed | |||||
| Adoption Rate i Scale Low Medium High | |||||
| New Entrants/Startups i Scale Low Medium High | |||||
| Macro Indicators i Scale Weak Stable Strong |
Key Country Insights
Germany 🇩🇪
Industrial IT MonitoringGermany prioritizes observability platforms that support manufacturing operations, enterprise applications, and industrial digitalization. Organizations in Germany increasingly seek integrated monitoring solutions that strengthen system reliability while supporting secure and efficient production environments.
France 🇫🇷
Compliance-Oriented ObservabilityFrance adopts observability platforms that combine application visibility with governance and data management priorities. Organizations in France continue strengthening monitoring capabilities while ensuring operational transparency and alignment with evolving digital compliance expectations.
Italy 🇮🇹
Modernization Support PlatformItaly leverages observability tools to improve performance across modernized enterprise infrastructure and business-critical applications. Companies in Italy increasingly implement centralized monitoring and analytics to simplify IT operations and enhance service reliability during digital transformation initiatives.
Japan 🇯🇵
Operational Reliability ManagementJapan emphasizes observability technologies that maintain service continuity across enterprise IT and digital services. Businesses in Japan continue investing in automated monitoring, performance analytics, and infrastructure visibility to minimize downtime and improve operational efficiency.
South Korea 🇰🇷
AI-Driven Infrastructure InsightsSouth Korea advances observability adoption through cloud expansion, digital services, and advanced application management. Enterprises in South Korea increasingly deploy intelligent monitoring platforms that provide real-time insights across distributed infrastructure and modern software environments.
United States 🇺🇸
Enterprise Cloud VisibilityThe U.S. observability tools and platforms market centers on monitoring complex hybrid and cloud-native environments. Enterprises in the U.S. increasingly adopt AI-assisted analytics and unified observability platforms to improve operational resilience and accelerate incident resolution across digital infrastructure.
Segment Leadership and Growth Trends
Observability Tools and Platforms Market Share (%), by Component, 2026
Go beyond the chart, access full insights & data tables
Request Free Sample ReportComponent Segment Analysis: Solutions (Largest Segment) vs Services (Fastest-Growing Segment)
The solutions segment accounted for the largest share of 65.96% in 2026, reflecting the central role of observability platforms in collecting, correlating, and analyzing telemetry data from increasingly complex technology environments. Organizations rely on observability solutions to improve visibility across applications, infrastructure, networks, and cloud workloads while identifying performance issues before they significantly affect operations. Growing adoption of distributed architectures and digital services is increasing the importance of integrated monitoring and analytics capabilities.
Services represent the fastest-growing component segment as organizations require specialized expertise to deploy, configure, integrate, and optimize observability environments. Complex technology stacks often require tailored implementation strategies and ongoing support to ensure monitoring tools provide actionable insights across interconnected systems. Increasing reliance on hybrid and cloud-native infrastructures is consequently creating stronger demand for professional and managed observability services.
Deployment Segment Analysis: Cloud (Largest & Fastest-Growing Segment)
The cloud segment led the observability tools and platforms market in 2026 and is also the fastest-growing deployment segment, supported by the increasing adoption of scalable, distributed, and cloud-native technology environments. Cloud-based observability enables organizations to monitor applications and infrastructure across dynamic workloads without maintaining extensive monitoring infrastructure locally. Its flexibility, centralized visibility, and ability to scale with changing workloads make cloud deployment particularly well suited to modern digital operations.
| Segment | Sub-Segment | Largest Segment | Fastest Growing |
|---|---|---|---|
| Component | Solutions, Services | Solutions | Services |
| Deployment | Cloud, On-premises | Cloud | Cloud |
| Organization Size | Large Enterprises, SMEs | Large Enterprises | SMEs |
| Vertical | Manufacturing, Retail & E-commerce, Government & Public Sector, IT & Telecommunications, Healthcare & Life Sciences, BFSI, Others | IT & Telecommunications | Retail & E-commerce |
Competitive Landscape and Market Positioning
Key companies in the observability tools and platforms market:
1. Dynatrace Inc. (United States)
2. Splunk Inc. (United States)
3. Microsoft Corporation (United States)
4. International Business Machines Corporation (United States)
5. Broadcom Inc. (United States)
6. Datadog Inc. (United States)
7. New Relic Inc. (United States)
8. LogicMonitor Inc. (United States)
9. ScienceLogic Inc. (United States)
10. Riverbed Technology LLC (United States)
The observability tools and platforms market is expanding with integrated monitoring solutions that improve system visibility and operational efficiency. Enhanced analytics capabilities are enabling better performance tracking across complex IT environments. The observability tools and platforms market is also driven by increasing adoption of cloud-native infrastructure monitoring.
| Company | Market Share | Company Revenue | Revenue CAGR (%) | Product Portfolio | Geographic Presence | Innovation / R&D Focus | Strategic Developments |
|---|---|---|---|---|---|---|---|
| Dynatrace Inc. (United States) | |||||||
| Splunk Inc. (United States) | |||||||
| Microsoft Corporation (United States) | |||||||
| International Business Machines Corporation (United States) | |||||||
| Broadcom Inc. (United States) | |||||||
| Datadog Inc. (United States) | |||||||
| New Relic Inc. (United States) | |||||||
| LogicMonitor Inc. (United States) | |||||||
| ScienceLogic Inc. (United States) | |||||||
| Riverbed Technology LLC (United States). |
Industry Development/News
| Company Name | Date | Key Development |
|---|---|---|
| Riverbed Technology | May-24 | Riverbed Technology introduced an AI-powered observability and acceleration platform to streamline IT operations. The solution automates cross-domain data analysis, diagnosis, and remediation, addressing the strategic need for IT teams to manage massive data volumes while reducing alert fatigue and improving the speed of digital service delivery. |
| Dynatrace, Inc. | Jan-24 | Dynatrace launched AI-driven data observability capabilities, integrating a comprehensive range of security, business, and event data into its platform. By fueling the Davis AI engine with this expanded data set, the company enhances its competitive position in providing automated, reliable business analytics for modern, complex cloud ecosystems. |
| ScienceLogic | Jan-24 | ScienceLogic partnered with LTIMindtree to provide a cohesive observability platform focused on cloud resource optimization. This collaboration combines platform capabilities to enhance visibility and scalability for enterprises, supporting digital innovation by enabling organizations to effectively manage complex cloud infrastructures and improve operational efficiency. |
| Dynatrace | May-23 | Dynatrace collaborated with Red Hat to integrate AI-powered insights with the Red Hat Ansible Automation Platform. This partnership facilitates closed-loop issue remediation and automated incident response for DevSecOps teams, enabling enterprises to mature their automation practices and ensure secure, seamless digital experiences across their technical infrastructure. |
| Dynatrace | Feb-23 | Dynatrace launched AppEngine, a low-code platform technology that enables users to build custom, intelligent, data-driven applications. By unlocking insights from cloud data for BizDevSecOps use cases, this technology significantly improves the capability of organizations to develop bespoke, compliant solutions for service reliability and carbon impact monitoring. |
| ScienceLogic | Oct-22 | ScienceLogic acquired ML analytics firm Zebrium to automate root cause analysis for containerized and cloud-native applications. This acquisition strategically enhances the platform's diagnostic capabilities, significantly reducing the time required to identify and resolve service-impacting issues, thereby lowering IT costs and improving user experience. |
| Auvik | Oct-22 | Auvik acquired Saaslio and Boardgent to extend its network monitoring capabilities to the "last mile" of the office network. The integration of these tools provides IT professionals with superior control, visibility, and troubleshooting capabilities, strengthening Auvik's unified platform offering for modern network management and monitoring. |
Customize Your Report
Explore examples of how this report can be tailored to different research needs, including custom segments, additional topics or chapters, and related reports. Click a section of the wheel or its numbered marker to explore the available options.
Observability Tools and Platforms Market — Custom Segments
| Segment | Sub-Segment |
|---|---|
| Observability Domain | Application Performance Monitoring, Infrastructure Monitoring, Network Monitoring, Log Management, Real User Monitoring |
| Use Case | Application Performance Management, Cloud & Infrastructure Monitoring, DevOps & Site Reliability Engineering, Security Monitoring, Business Performance Monitoring |
| Pricing Model | Subscription-Based, Usage-Based, Per-Host or Per-Node, Per-User, Consumption-Based |
Observability Tools and Platforms Market — Custom TOC
| Custom Chapter | Custom Details |
|---|---|
| Enterprise Observability Maturity Benchmarking |
|
| Cloud-Native Migration Impact Assessment |
|
| AI-Driven IT Operations Adoption Landscape |
|
Need a different cut of the data?
Request Custom ResearchHow big is the observability tools and platforms market?
What is the anticipated CAGR of the observability tools and platforms industry?
How is cloud-native and microservices adoption influencing demand for observability platforms?
What role is AI-driven analytics playing in the evolution of observability platforms?
Why do Solutions dominate the observability tools and platforms market?
Why is Cloud the fastest-growing deployment segment in the observability tools and platforms market?
Why does North America lead the observability tools and platforms market?
How is Asia Pacific expanding in observability platforms?
Who are the major participants shaping the observability tools and platforms landscape?
Our Clients
"The team demonstrated a great understanding of our business needs, and the reports were tailored to address our specific concerns and objectives."
Infosys
"The report was up-to-date with the latest industry trends and technological advancements. The detailed competitive landscape analysis was quite helpful."
Zebra Technologies
"The data presented in the report was accurate and well-researched. I also found the market dynamics section particularly useful."
Arlo Technologies
Our Research Team & Methodology
Every Fundamental Business Insights report is built by a dedicated vertical research team, validated through a structured primary-and-secondary methodology, and reviewed for accuracy before it reaches you.
Research Team Overview
Prepared by the Smart Technologies Research Team
Delivery
Published
Demand
Available
Support
Trust & Compliance
Research Domains
10 coverage areasResearch Intelligence
| Source | Reference |
|---|---|
| National Institute of Standards and Technology (NIST) | www.nist.gov |
| International Organization for Standardization (ISO) | www.iso.org |
| Institute of Electrical and Electronics Engineers (IEEE) | www.ieee.org |
| Internet Engineering Task Force (IETF) | www.ietf.org |
| World Wide Web Consortium (W3C) | www.w3.org |
| Cloud Security Alliance (CSA) | cloudsecurityalliance.org |
| Open Source Initiative (OSI) | opensource.org |
| Linux Foundation | www.linuxfoundation.org |
| FinOps Foundation | www.finops.org |
| PCI Security Standards Council | www.pcisecuritystandards.org |
| SWIFT | www.swift.com |
| Financial Stability Board (FSB) | www.fsb.org |
| GSMA | www.gsma.com |
| International Telecommunication Union (ITU) | www.itu.int |
| OWASP Foundation | owasp.org |
| MITRE | www.mitre.org |
| World Economic Forum (WEF) | www.weforum.org |
| OECD Digital Economy | www.oecd.org/digital |
| World Bank Data | data.worldbank.org |
| U.S. Census Bureau | www.census.gov |
Research Workflow & Quality Assurance
Data Collection
Verified information gathered through primary and secondary research.
Data Triangulation
Cross-validation using multiple independent data sources.
Forecast Modelling
Market estimates developed using historical trends and analytical models.
Analyst Validation
Findings reviewed by domain experts for accuracy and consistency.
Editorial & Quality Review
Final editorial, quality, and compliance checks before publication.
Final Publication
Released after successful completion of the internal review process.
Report Coverage
📊 Market Assessment
- Market Size & Forecast
- Market Segmentation
- Regional Analysis
- Growth Drivers & Challenges
- Market Dynamics
🏢 Competitive Intelligence
- Competitive Landscape
- Company Profiles
- Competitive Benchmarking
- Mergers & Acquisitions
- Market Share Analysis or Key Company Strategies
🔍 Strategic Analysis
- Value Chain Analysis
- Porter's Five Forces
- PESTLE Analysis
- Pricing Trends
- Supply-Demand Analysis
🚀 Future Outlook
- Technology Landscape
- Regulatory Landscape
- Investment & Funding Landscape
- Emerging Opportunities
- Future Market Outlook
Have a question about this report or need a custom scope?
Request Customization