Frac Sand Market Size & Growth Forecast 2027–2036, By Segments (Application, Product), Regional Demand Trends (North America, Asia Pacific, Europe), Key Country Insights (U.S., Japan, South Korea, Germany, France, Italy), and Competitive Landscape
Market Size and Growth Outlook
Frac Sand Market size was estimated at USD 8.35 billion in 2026 and is projected to grow at a 3.9% CAGR from 2027 to 2036, surpassing USD 12.24 billion by 2036. The industry revenue for 2027 is assessed at USD 8.62 billion.
Get more details on this report
Request Free Sample ReportFrac Sand Market Intelligence Snapshot
Regional Market Dynamics
- North America accounted for 57.75% of the market in 2026, supported by extensive hydraulic fracturing activity and well-developed mining, processing, and logistics infrastructure serving shale operations.
- Asia Pacific is projected to grow at a 9.49% CAGR, driven by expanding exploration activities, increasing domestic energy production, and investments in frac sand supply chain infrastructure.
Segment Momentum
- Oil Exploration accounted for 79.8% of the market in 2026, supported by intensive hydraulic fracturing programs that require large sand volumes to improve well productivity and recovery.
- White Sand is both the largest and fastest-growing product segment because operators favor its established quality, reliable performance, and acceptance across hydraulic fracturing supply chains.
Market Expansion Drivers
- Intensifying hydraulic fracturing operations increasing proppant intensity per well.
- Expansion of in-basin mining and logistics infrastructure reducing transportation costs.
- Environmental regulations and zoning constraints limiting new mine approvals.
Leading Market Participants
- Top players in the frac sand market include U.S. Silica Holdings, Inc. (United States), Covia Holdings LLC (United States), Sibelco Group (Belgium), Hi-Crush Inc. (United States), Smart Sand, Inc. (United States), Atlas Energy Solutions Inc. (United States), Black Mountain Sand LLC (United States), Badger Mining Corporation (United States), Pattison Company, LLC (United States), Emerge Energy Services LP (United States).
Global Market Forecast Snapshot
Market Outlook
- 2026 Market Size: USD 8.35 billion
- 2027 Estimated Market Size: USD 8.62 billion.
- Projected Market Size: USD 12.24 billion by 2036
- Growth Forecast: 3.9% CAGR (2027-2036)
Regional and Segment Outlook
- Leading Regional Market: North America
- High-Growth Regional Hub: Asia Pacific
- Core Revenue Segment: Oil Exploration (Application) | White Sand (Product)
- Emerging Opportunity Segment: Natural Gas Exploration (Application) | White Sand (Product)
Market Growth Drivers and Industry Trends
Intensifying hydraulic fracturing operations increasing proppant intensity per well
The continued use of hydraulic fracturing is increasing requirements for proppants that keep fractures open and support the flow of hydrocarbons from unconventional reservoirs. As operators pursue improved well productivity, drilling programs can incorporate greater volumes of proppant across longer or more intensively stimulated well sections. This trend directly supports the frac sand market because silica sand remains an important proppant material used during hydraulic fracturing operations. Increasing completion intensity, longer lateral wells, and efforts to optimize hydrocarbon recovery can raise sand consumption during individual well treatments, particularly in formations where high-volume hydraulic fracturing remains central to production strategies.
Expansion of in-basin mining and logistics infrastructure reducing transportation costs
The development of sand mines and supporting logistics closer to major shale-producing regions is improving the efficiency of proppant supply chains. For the frac sand market, in-basin production can reduce dependence on long-distance transportation from traditional sand-producing regions and lower the logistical burden associated with moving large quantities of heavy material. Localized mining operations can also support faster delivery to well sites, helping hydraulic fracturing contractors coordinate sand requirements with drilling and completion schedules. Improvements in rail connections, transloading facilities, storage terminals, and last-mile delivery infrastructure further strengthen the ability of suppliers to provide proppant efficiently within active oil and gas basins.
Environmental regulations and zoning constraints limiting new mine approvals
Environmental requirements and local zoning restrictions can make the development of new frac sand extraction facilities more difficult, particularly in regions where mining activities face concerns related to land use, water consumption, dust, traffic, and ecosystem impacts. These constraints can restrict the availability of suitable sites and lengthen the approval process for new production capacity, influencing how suppliers expand their operations. Within the frac sand market, tighter permitting conditions can also encourage greater attention to existing mine productivity, resource quality, processing efficiency, and the utilization of established logistics networks. Operators must account for regulatory requirements across extraction, processing, transportation, and site development activities when planning additional sand supply capacity.
| Growth Driver | Impact on CAGR | Regulatory Influence | Geographic Relevance | Adoption Rate | Impact Timeline |
|---|---|---|---|---|---|
| Increasing hydraulic fracturing and oilfield activities | 2.80% | Short term (≤ 2 yrs) | North America, Middle East | Medium | Fast |
| Technological advancements in frac sand processing | 2.80% | Medium term (2–5 yrs) | North America, Asia Pacific | Low | Moderate |
| Expansion of shale gas and oil extraction in emerging regions | 2.80% | Long term (5+ yrs) | Asia Pacific, Latin America | Low | Slow |
| Intensifying hydraulic fracturing operations increasing proppant intensity per well | 3.20% | Moderate | North America | High | Near Term |
| Expansion of in-basin mining and logistics infrastructure reducing transportation costs | 2.60% | Low | North America | High | Mid Term |
| Environmental regulations and zoning constraints limiting new mine approvals | 2.10% | High | North America | Medium | Mid Term |
Unlock insights tailored to your business with our bespoke market research solutions.
Click to get your customized report now.
Regional Demand Dynamics
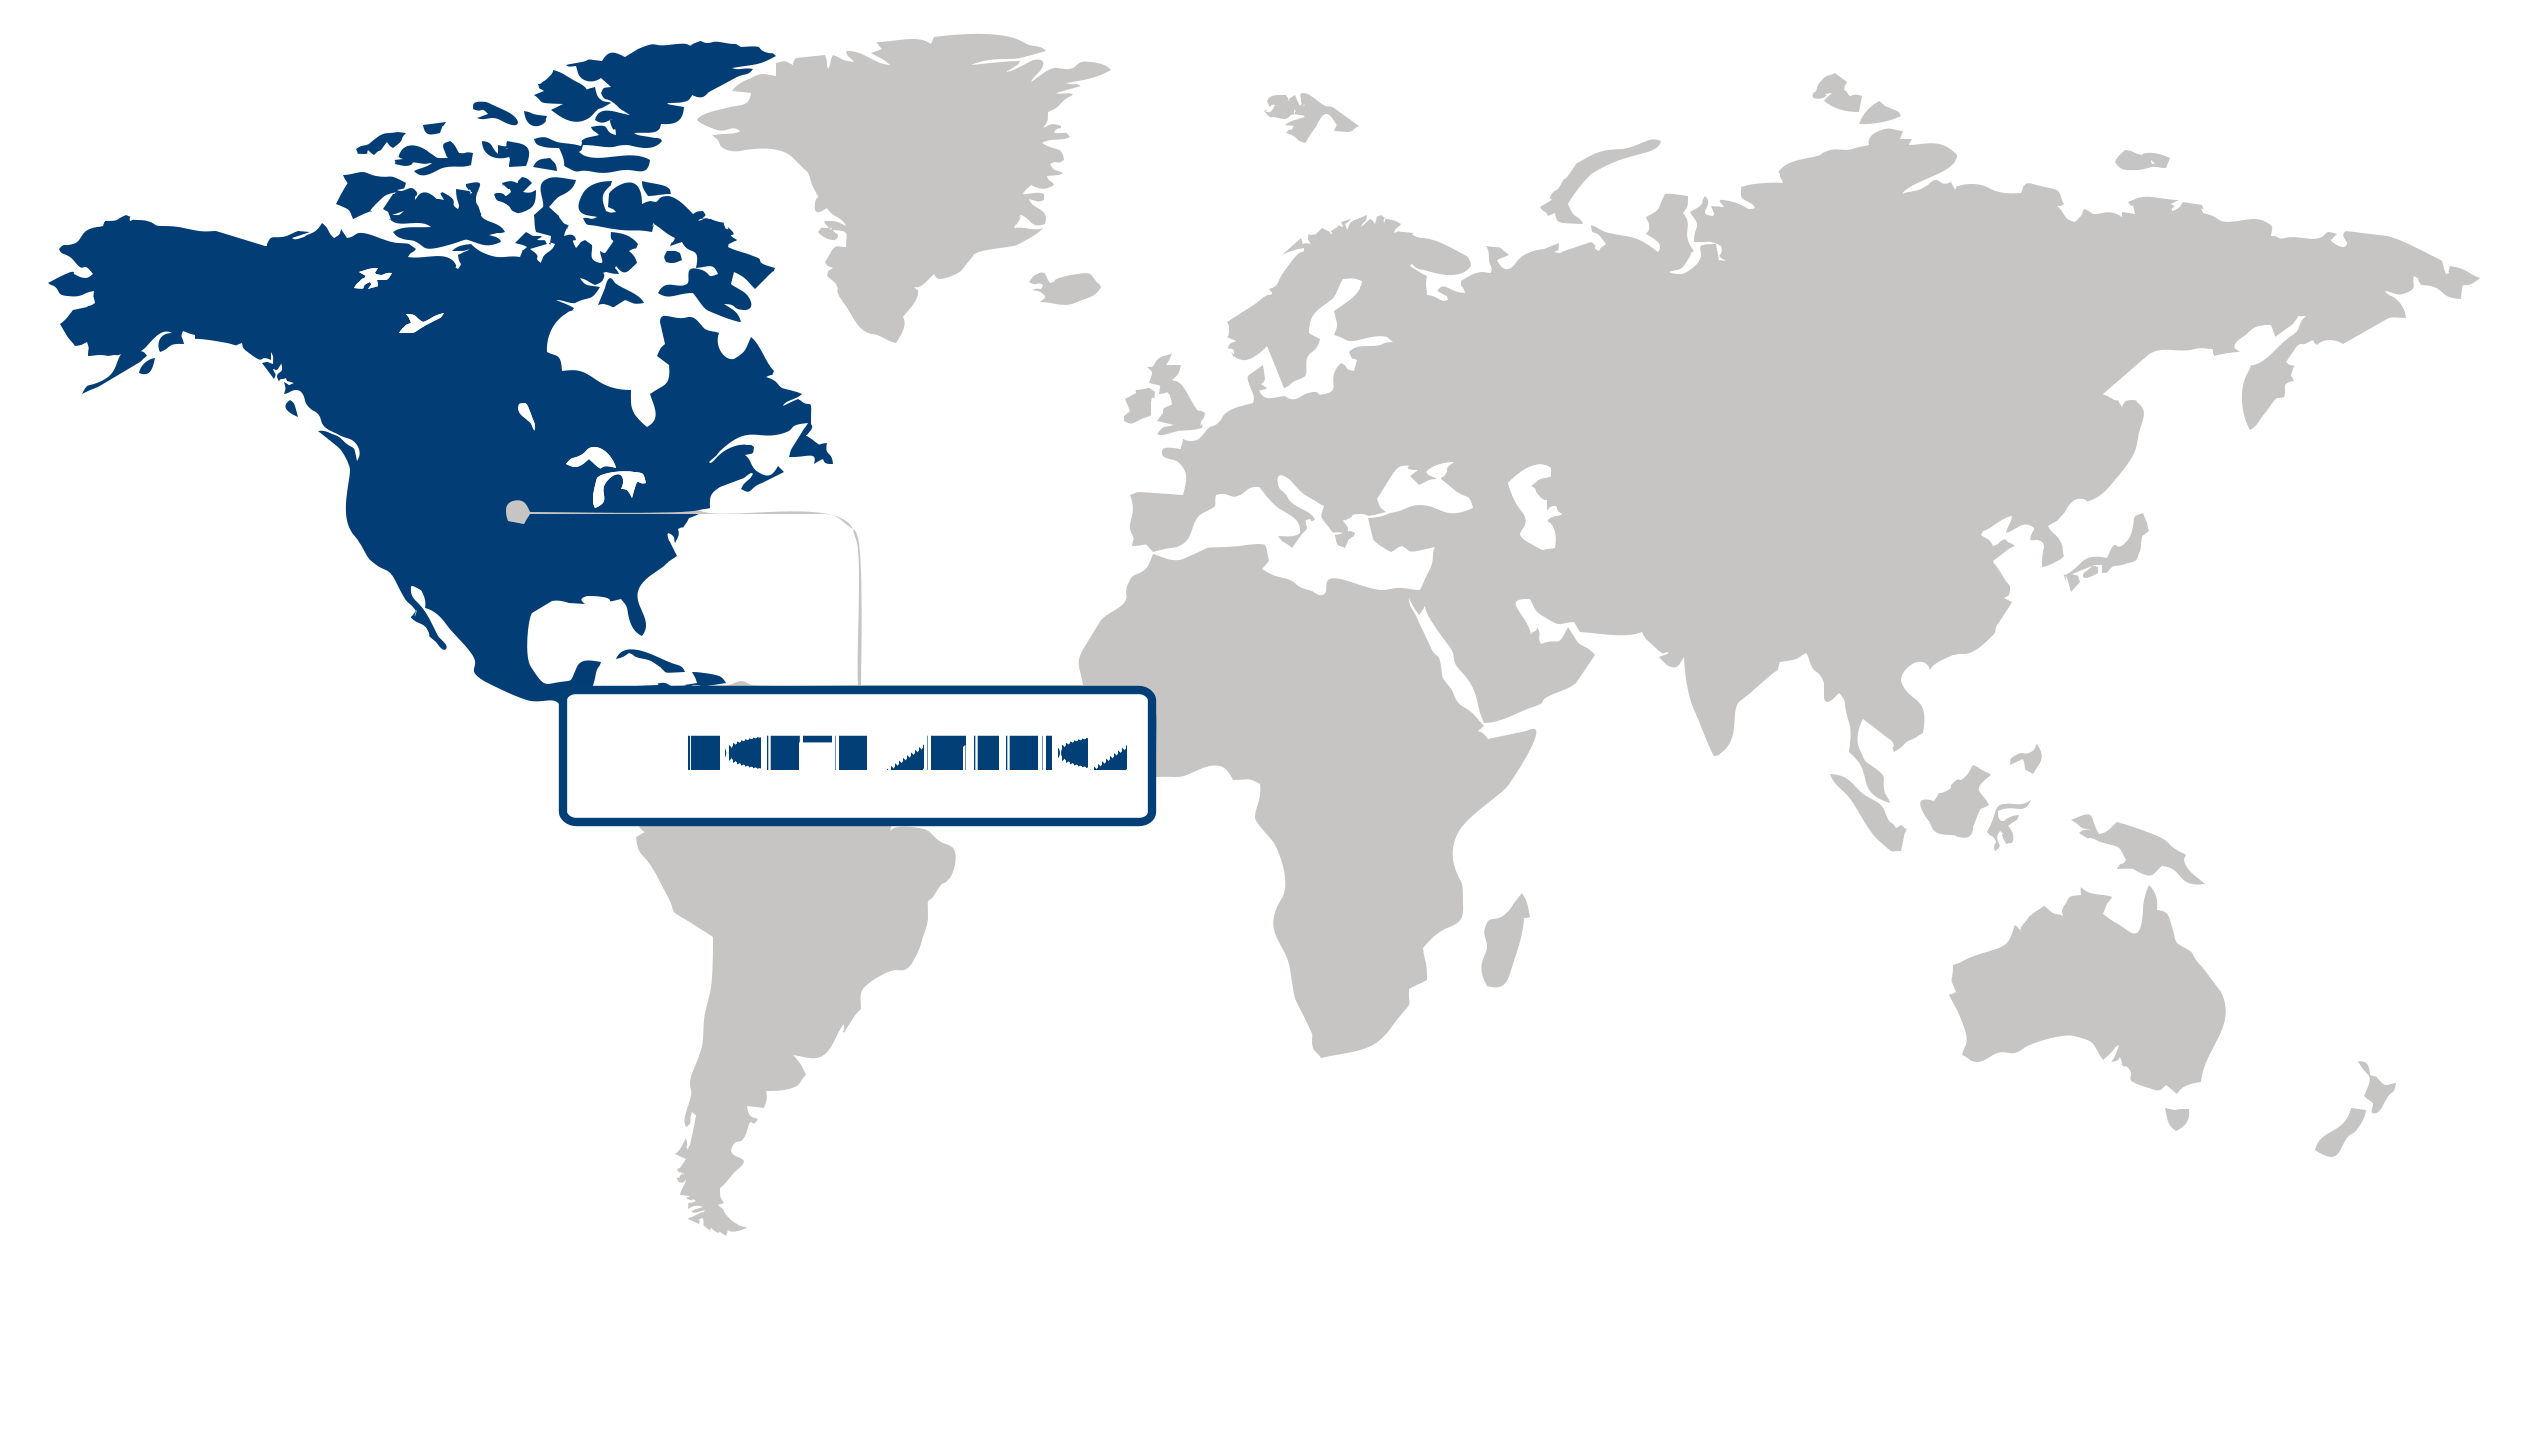
North America (Largest Region)
North America dominated the frac sand market with a 57.75% share in 2026, reflecting the region's strong unconventional oil and gas production base and extensive hydraulic fracturing activity. Frac sand remains an essential proppant in well stimulation, supporting demand from operators seeking effective reservoir productivity and efficient completion processes. The region benefits from established sand mining and processing capabilities, developed transportation networks, and proximity between major supply areas and oil and gas producing regions. Continued investment in shale development and well completion technologies is sustaining demand for high-quality, consistently processed sand. Improvements in logistics, processing efficiency, and supply chain management are also helping producers meet the technical requirements of modern hydraulic fracturing operations.
Asia Pacific (Fastest-Growing Region)
Asia Pacific is the fastest-growing region, supported by increasing efforts to develop domestic energy resources and expand unconventional hydrocarbon exploration. Growing energy demand is encouraging investment in oil and gas infrastructure, while improvements in drilling and completion technologies are creating greater opportunities for hydraulic fracturing applications. As regional producers seek to improve recovery from complex formations, demand for suitable proppant materials is gaining importance. Infrastructure development and strengthening energy supply chains are also improving the feasibility of supporting specialized well-completion activities. Greater adoption of advanced extraction techniques and continued investment in domestic resource development are creating favorable conditions for expansion of frac sand consumption across the region.
| Parameter | North America | Asia Pacific | Europe | Latin America | MEA |
|---|---|---|---|---|---|
| Innovation Hub i Scale Nascent Developing Advanced | |||||
| Cost-Sensitive Region i Scale Low Medium High | |||||
| Regulatory Environment i Scale Restrictive Neutral Supportive | |||||
| Demand Drivers i Scale Weak Moderate Strong | |||||
| Development Stage i Scale Emerging Developing Developed | |||||
| Adoption Rate i Scale Low Medium High | |||||
| New Entrants / Startups i Scale Sparse Moderate Dense | |||||
| Macro Indicators i Scale Weak Stable Strong |
Key Country Insights
Germany 🇩🇪
Industrial Import DependencyIn Germany, frac sand usage is largely driven by imported specialty grades for industrial applications rather than domestic extraction. Germany focuses on consistent material quality and supply reliability, particularly for manufacturing and engineering processes requiring controlled specifications and stable procurement channels.
France 🇫🇷
Selective Industrial ConsumptionIn France, frac sand demand is driven by selective industrial and construction applications rather than energy extraction activity. France emphasizes regulatory compliance and environmentally aligned sourcing, with usage concentrated in specialized engineering and infrastructure development projects.
Italy 🇮🇹
Infrastructure Project DemandIn Italy, frac sand consumption is associated with infrastructure development and civil engineering works, particularly within public construction initiatives. Italy emphasizes material reliability and project-based procurement cycles driven by periodic infrastructure investment programs.
Japan 🇯🇵
Limited Domestic Usage FocusIn Japan, frac sand consumption remains constrained due to limited domestic extraction activity, with demand centered on niche industrial and imported applications. Japan emphasizes high material purity and consistency for specialized manufacturing uses rather than energy extraction-related deployment.
South Korea 🇰🇷
Energy Import Reliance HubIn South Korea, frac sand market dynamics are shaped by reliance on imported raw materials for industrial and infrastructure-related applications. South Korea prioritizes supply chain stability and logistics efficiency to support construction and manufacturing activities requiring consistent material performance.
United States 🇺🇸
Shale Basin Supply CoreIn the United States, frac sand demand is tightly linked to shale oil and gas drilling activity, with integrated supply chains centered around major basins. The U.S. prioritizes logistics efficiency, consistent particle quality, and proximity to drilling sites to minimize transportation costs and ensure uninterrupted well completion operations.
Segment Leadership and Growth Trends
Frac Sand Market Share (%), by Application, 2026
Go beyond the chart, access full insights & data tables
Request Free Sample ReportApplication Segment Analysis: Oil Exploration (Largest Segment) vs Natural Gas Exploration (Fastest-Growing Segment)
The oil exploration segment dominated the frac sand market, accounting for 79.8% share in 2026, supported by the extensive use of hydraulic fracturing to enhance crude oil recovery from unconventional reservoirs. Frac sand serves as a critical proppant in maintaining fracture conductivity after stimulation, enabling hydrocarbons to flow more efficiently through low-permeability formations. Continued reliance on hydraulic fracturing for oil production and the need to improve well productivity reinforce the segment's leading position.
Natural gas exploration is expected to be the fastest-growing application segment, driven by increasing emphasis on unconventional gas production and the expanding use of hydraulic fracturing in gas-bearing formations. The ability of frac sand to maintain open fractures and support sustained gas flow makes it integral to well stimulation activities. Rising demand for natural gas and continued development of shale and other unconventional resources are supporting greater consumption of frac sand across gas exploration operations.
Product Segment Analysis: White Sand (Largest & Fastest-Growing Segment)
The white sand segment held the largest share and is also expected to be the fastest-growing segment in the frac sand market, reflecting its favorable characteristics for hydraulic fracturing applications. Its high purity and strong proppant performance make white sand suitable for maintaining fracture pathways and supporting efficient hydrocarbon recovery. Growing preference for high-quality proppants, together with continued adoption of hydraulic fracturing across unconventional oil and gas operations, is strengthening demand for white sand.
| Segment | Sub-Segment | Largest Segment | Fastest Growing |
|---|---|---|---|
| Application | Natural Gas Exploration, Oil Exploration, Others | Oil Exploration | Natural Gas Exploration |
| Product | White Sand, Brown Sand, Others | White Sand | White Sand |
Competitive Landscape and Market Positioning
Major players in the frac sand market:
1. U.S. Silica Holdings Inc. (United States)
2. Covia Holdings LLC (United States)
3. Sibelco Group (Belgium)
4. Hi-Crush Inc. (United States)
5. Smart Sand Inc. (United States)
6. Atlas Energy Solutions Inc. (United States)
7. Black Mountain Sand LLC (United States)
8. Badger Mining Corporation (United States)
9. Pattison Company LLC (United States)
10. Emerge Energy Services LP (United States)
In the frac sand market, increasing upstream energy activity is driving higher consumption across hydraulic fracturing operations. Continuous improvements in logistics and processing efficiency are enhancing supply reliability. Collaborative supply chain strategies are expanding distribution reach, while rising exploration activity is strengthening market growth momentum.
| Company | Market Share | Company Revenue | Revenue CAGR (%) | Product Portfolio | Geographic Presence | Innovation / R&D Focus | Strategic Developments |
|---|---|---|---|---|---|---|---|
| U.S. Silica Holdings Inc. (United States) | |||||||
| Covia Holdings LLC (United States) | |||||||
| Sibelco Group (Belgium) | |||||||
| Hi-Crush Inc. (United States) | |||||||
| Smart Sand Inc. (United States) | |||||||
| Atlas Energy Solutions Inc. (United States) | |||||||
| Black Mountain Sand LLC (United States) | |||||||
| Badger Mining Corporation (United States) | |||||||
| Pattison Company LLC (United States) | |||||||
| Emerge Energy Services LP (United States). |
Industry Development/News
| Company Name | Date | Key Development |
|---|---|---|
| PlusAI | Jan-26 | PlusAI has strengthened its OEM collaboration with Traton Group to accelerate the production of autonomous trucking systems. This development is strategically relevant to the bulk commodity logistics sector, particularly for frac sand transportation, as it enables the deployment of automated, high-reliability freight solutions to optimize industrial supply chains. |
| Aurora | Dec-25 | Aurora and Detmar Logistics have entered an agreement to deploy autonomous tractors for frac sand hauling on public roads in Texas. This initiative represents a significant shift in energy logistics, aiming to reduce driver dependency, improve transportation efficiency, and scale long-haul sand distribution across high-demand shale production regions. |
| Delta Sands | Nov-25 | Delta Sands announced plans to construct a 3-million-ton-per-year wet frac sand processing facility in the Western Haynesville region. This strategic infrastructure investment is designed to enhance in-basin proppant supply chains, improving regional logistics efficiency and ensuring consistent, proximity-based supply for natural gas operators requiring high-volume sand inputs in East Texas. |
| U.S. Silica Holdings | Mar-25 | U.S. Silica Holdings completed facility upgrades at a Texas processing site to increase production capacity for regionally sourced frac sand. The expansion leverages new process-control systems to ensure consistent product specifications and supply reliability, addressing growing offtake demands from oil and gas operators during peak drilling cycles in the region. |
| Konya Mining Co | Mar-25 | Konya Mining Co’s subsidiary, Konya Sands, acquired multiple sand mining assets in Arkansas. This acquisition enhances the company's production base for high-quality silica sand, strengthening its regional supply capabilities and extending its reach within North American industrial markets to meet increasing energy-related demand for proppant materials. |
| KAG Canada | Mar-25 | KAG Canada acquired Pro-N2, a transportation and logistics provider specializing in frac sand and industrial commodities. This acquisition expands KAG’s energy logistics footprint across Canada, reinforcing its capacity to provide integrated, large-scale supply chain solutions and bulk material transportation for oilfield and industrial customers. |
| Hi-Crush Inc. | Feb-25 | Hi-Crush Inc. expanded its last-mile logistics infrastructure in the Permian Basin by commissioning new storage and handling units. By integrating automated loading systems, the company aims to streamline proppant delivery, reduce transportation-related downtime at well sites, and enhance operational continuity for its energy sector clients. |
| Smart Sand Inc. | Jan-25 | Smart Sand Inc. upgraded its rail-based transloading network to increase throughput capacity for frac sand shipments to major shale basins. This infrastructure enhancement is designed to optimize material movement, improve coordination between mining and distribution activities, and support the fulfillment of long-term customer contracts during periods of peak market demand. |
| Konya Silica | Dec-24 | Konya Silica completed the acquisition of Southern Ohio Sands and Beaver Pike Enterprises, significantly consolidating its footprint in the Appalachian silica sand market. The transaction expands the company's production capacity and strengthens its regional leadership in supplying high-quality proppant-grade materials to the energy, construction, and manufacturing sectors. |
Customize Your Report
Explore examples of how this report can be tailored to different research needs, including custom segments, additional topics or chapters, and related reports. Click a section of the wheel or its numbered marker to explore the available options.
Frac Sand Market — Custom Segments
| Segment | Sub-Segment |
|---|---|
| Well Completion Type | Horizontal Wells, Vertical Wells, Multilateral Wells |
| Delivery & Logistics Mode | Truck Transportation, Rail Transportation, Barge Transportation |
| Coating Type | Uncoated Sand, Resin-Coated Sand, Ceramic-Coated Sand |
Frac Sand Market — Custom TOC
| Custom Chapter | Custom Details |
|---|---|
| Basin-Level Demand Opportunity Assessment |
|
| Alternative Proppant Adoption Outlook |
|
| Supply Chain Resilience Assessment |
|
Need a different cut of the data?
Request Custom ResearchHow much is the frac sand market worth?
How will the frac sand industry grow in terms of size and CAGR by 2036?
How is intensifying hydraulic fracturing activity influencing proppant demand in the frac sand market?
What role does in-basin logistics infrastructure play in reshaping supply dynamics in the frac sand market?
Why does Oil Exploration dominate the frac sand market?
Which product segment is growing the fastest in the frac sand market?
Why does North America lead the frac sand market?
What is accelerating frac sand market growth in Asia Pacific?
What are the key competitors in the frac sand landscape?
Our Clients
"The report helped us understand emerging consumer trends in our product category. It clarified where to focus innovation for the next product launch."
LyondellBasell
"The regional forecast section was incredibly useful. We were able to identify two new potential partners in Europe thanks to the vendor mapping you included."
SABIC
"We appreciated how actionable the recommendations were. It guided us to improve supply chain resilience."
Olin Corporation
Our Research Team & Methodology
Every Fundamental Business Insights report is built by a dedicated vertical research team, validated through a structured primary-and-secondary methodology, and reviewed for accuracy before it reaches you.
Research Team Overview
Prepared by the Chemicals & Materials Research Team
Delivery
Published
Demand
Available
Support
Trust & Compliance
Research Domains
10 coverage areasResearch Intelligence
| Source | Reference |
|---|---|
| American Chemistry Council (ACC) | www.americanchemistry.com |
| European Chemical Industry Council (Cefic) | cefic.org |
| International Council of Chemical Associations (ICCA) | icca-chem.org |
| European Chemicals Agency (ECHA) | echa.europa.eu |
| U.S. Environmental Protection Agency (EPA) | www.epa.gov |
| ASTM International | www.astm.org |
| International Organization for Standardization (ISO) | www.iso.org |
| National Institute of Standards and Technology (NIST) | www.nist.gov |
| Plastics Industry Association (PLASTICS) | www.plasticsindustry.org |
| European Biplastics | www.european-bioplastics.org |
| The Adhesive and Sealant Council (ASC) | www.ascouncil.org |
| National Association of Corrosion Engineers (AMPP) | www.ampp.org |
| Society of Plastics Engineers (SPE) | www.4spe.org |
| International Fertilizer Association (IFA) | www.fertilizer.org |
| CropLife International | croplife.org |
| Packaging Europe | packagingeurope.com |
| Flexible Packaging Association (FPA) | www.flexpack.org |
| Battery Council International (BCI) | batterycouncil.org |
| International Copper Association (ICA) | internationalcopper.org |
| World Steel Association | worldsteel.org |
Research Workflow & Quality Assurance
Data Collection
Verified information gathered through primary and secondary research.
Data Triangulation
Cross-validation using multiple independent data sources.
Forecast Modelling
Market estimates developed using historical trends and analytical models.
Analyst Validation
Findings reviewed by domain experts for accuracy and consistency.
Editorial & Quality Review
Final editorial, quality, and compliance checks before publication.
Final Publication
Released after successful completion of the internal review process.
Report Coverage
📊 Market Assessment
- Market Size & Forecast
- Market Segmentation
- Regional Analysis
- Growth Drivers & Challenges
- Market Dynamics
🏢 Competitive Intelligence
- Competitive Landscape
- Company Profiles
- Competitive Benchmarking
- Mergers & Acquisitions
- Market Share Analysis or Key Company Strategies
🔍 Strategic Analysis
- Value Chain Analysis
- Porter's Five Forces
- PESTLE Analysis
- Pricing Trends
- Supply-Demand Analysis
🚀 Future Outlook
- Technology Landscape
- Regulatory Landscape
- Investment & Funding Landscape
- Emerging Opportunities
- Future Market Outlook
Have a question about this report or need a custom scope?
Request Customization