Crop Micronutrients Market Size & Growth Forecast 2027–2036, By Segments (Form, Application, Crop Type, Type), Regional Demand Trends (North America, Asia Pacific, Europe), Key Country Insights (U.S., Japan, South Korea, Germany, France, Italy), and Competitive Landscape
Market Size and Growth Outlook
Crop Micronutrients Market size was more than USD 7.25 billion in 2026 and is set to grow at a 6.94% CAGR between 2027 and 2036, surpassing USD 14.18 billion by 2036. The industry revenue for 2027 is calculated at USD 7.67 billion.
Get more details on this report
Request Free Sample ReportCrop Micronutrients Market Intelligence Snapshot
Regional Market Dynamics
- Asia Pacific leads the market and is supported by intensive farming, increasing focus on soil nutrient balance, and broader integration of micronutrients into crop nutrition programs to improve productivity and efficiency.
- Asia Pacific is projected to grow at an 8.36% CAGR as farmers increasingly adopt micronutrient products to enhance crop quality, nutrient-use efficiency, and yields across mature and developing agricultural markets.
Segment Momentum
- Chelated products held a 67.9% share in 2026 because they provide improved micronutrient availability across varied soil conditions, delivering more consistent nutrient uptake, application efficiency, and reliable field performance.
- Fertigation is the fastest-growing application segment as it enables more controlled and precise micronutrient delivery through irrigation systems, helping growers improve nutrient management and input efficiency.
Market Expansion Drivers
- Rising soil micronutrient deficiencies increasing demand for crop yield enhancement solutions.
- Growing food security concerns accelerating adoption of advanced crop nutrition inputs.
- Expanding precision agriculture practices supporting targeted micronutrient application across commercial farming operations.
Leading Market Participants
- Leading companies in the crop micronutrients market include BASF SE (Germany), Nutrien Ltd. (Canada), Corteva Agriscience Inc. (U.S.), Yara International ASA (Norway), The Mosaic Company (U.S.), Nufarm Limited (Australia), Nouryon Holding B.V. (Netherlands), Compass Minerals International, Inc. (U.S.), Western Nutrients Corporation (U.S.), Syngenta AG (Switzerland).
Global Market Forecast Snapshot
Market Outlook
- 2026 Market Size: USD 7.25 billion
- 2027 Estimated Market Size: USD 7.67 billion.
- Projected Market Size: USD 14.18 billion by 2036
- Growth Forecast: 6.94% CAGR (2027-2036)
Regional and Segment Outlook
- Leading Regional Market: Asia Pacific
- High-Growth Regional Hub: Asia Pacific
- Core Revenue Segment: Chelated (Form) | Soil (Application) | Cereals & Grains (Crop Type) | Copper (Type)
- Emerging Opportunity Segment: Non-Chelated (Form) | Fertigation (Application) | Fruits & Vegetables (Crop Type) | Zinc (Type)
Market Growth Drivers and Industry Trends
Rising soil micronutrient deficiencies increasing demand for crop yield enhancement solutions
Rising soil micronutrient deficiencies are creating a direct need for targeted crop nutrition, which will drive the crop micronutrients market growth as farmers seek to correct nutrient imbalances that can restrict plant development and productivity. Essential micronutrients such as zinc, boron, iron, manganese, and copper support critical physiological processes including enzyme activity, photosynthesis, root development, and reproductive growth. Continuous cultivation, nutrient removal through harvesting, and inadequate replenishment can gradually reduce the availability of these elements in agricultural soils. Micronutrient products provide growers with more targeted options for addressing specific deficiencies through soil, foliar, or other application methods, allowing nutrient management programs to be tailored to crop and soil requirements. Greater awareness of hidden nutrient deficiencies is also encouraging commercial farming operations to incorporate micronutrient supplementation into broader fertility programs, particularly where conventional macronutrient applications alone do not adequately support crop performance.
Growing food security concerns accelerating adoption of advanced crop nutrition inputs
Food security concerns are strengthening demand for technologies that can improve agricultural productivity and resource efficiency, and the crop micronutrients market will benefit as growers increasingly incorporate specialized nutrition inputs into crop management programs. Maintaining adequate micronutrient availability can support stronger plant development, improve crop quality, and help crops utilize other available nutrients more effectively. As agricultural systems face pressure to produce sufficient food from existing cultivated land, farmers are placing greater emphasis on inputs that can address specific nutritional constraints rather than relying solely on broad fertilizer applications. Advanced micronutrient formulations can be incorporated into integrated nutrient management strategies according to crop requirements and soil conditions, supporting more balanced fertilization practices. The need to sustain productive farming systems while managing soil fertility is also increasing interest in nutritional inputs that complement conventional fertilizers and help maintain crop development under varying growing conditions.
Expanding precision agriculture practices supporting targeted micronutrient application across commercial farming operations
The growing use of precision agriculture is opening additional opportunities for the crop micronutrients market by enabling farmers to identify variations in soil nutrient availability and apply inputs more selectively across agricultural fields. Technologies such as soil mapping, remote sensing, field monitoring, and digital farm management systems provide greater visibility into differences in crop conditions and nutrient requirements within individual production areas. This information allows growers to design more targeted micronutrient application strategies, reducing reliance on uniform treatment when nutrient deficiencies are unevenly distributed. Commercial farming operations can use precision-based recommendations to align micronutrient applications with specific crop and field requirements, while improving the coordination of nutrient management activities with other agronomic practices. The combination of specialized crop nutrition products and data-driven application methods is strengthening the role of micronutrients within increasingly technology-enabled farming systems.
| Growth Driver | Impact on CAGR | Regulatory Influence | Geographic Relevance | Adoption Rate | Impact Timeline |
|---|---|---|---|---|---|
| Rising soil micronutrient deficiencies increasing demand for crop yield enhancement solutions | 2.00% | Moderate | Asia Pacific, Latin America | High | Near Term |
| Growing food security concerns accelerating adoption of advanced crop nutrition inputs | 1.80% | High | Asia Pacific, Middle East & Africa | High | Mid Term |
| Expanding precision agriculture practices supporting targeted micronutrient application across commercial farming operations | 1.30% | Moderate | North America, Europe, Asia Pacific | Emerging | Mid Term |
Unlock insights tailored to your business with our bespoke market research solutions.
Click to get your customized report now.
Regional Demand Dynamics
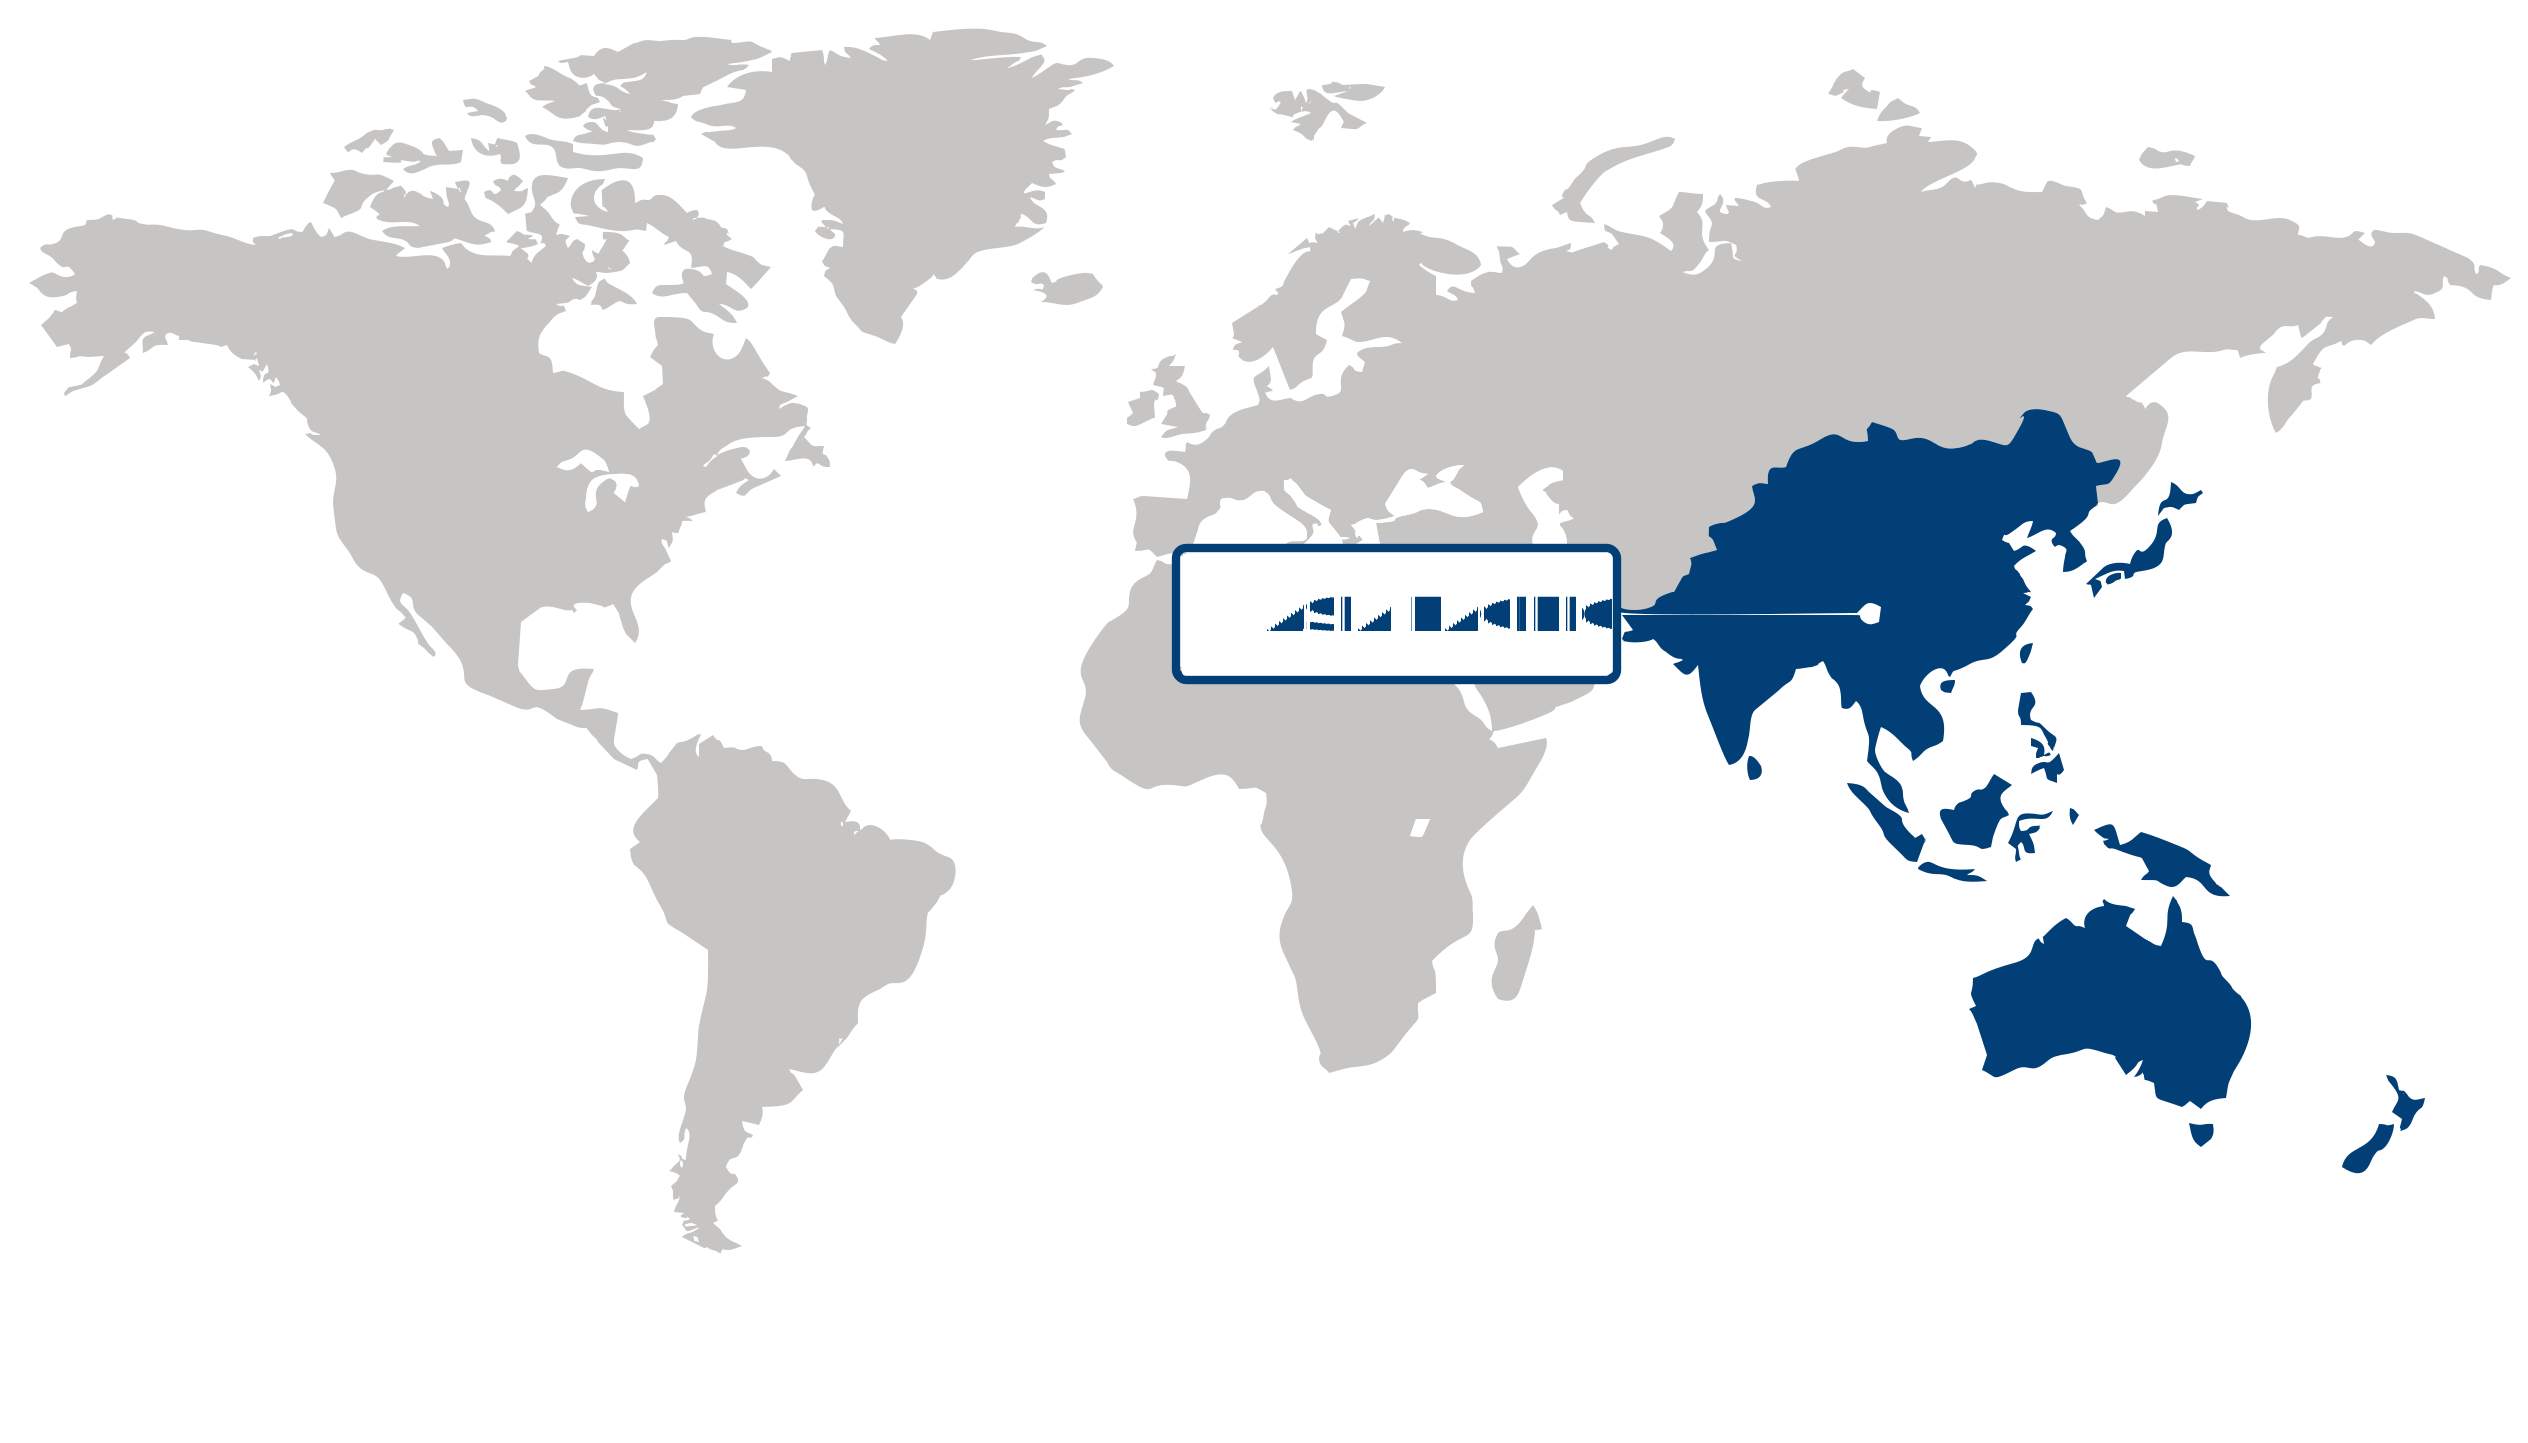
Asia Pacific (Largest & Fastest-Growing Region)
The Asia Pacific region led the crop micronutrients market as both the largest and fastest-growing regional market in 2026, supported by intensive agricultural activity, rising focus on crop productivity, and increasing awareness of the role of micronutrients in improving soil and plant health. The region's diverse farming systems and growing pressure to enhance yields from available arable land are encouraging greater adoption of targeted nutrient management practices. Demand is also being reinforced by efforts to address soil nutrient deficiencies and improve fertilizer-use efficiency, particularly as farmers increasingly seek solutions that support consistent crop quality and resilience. Expanding agricultural modernization, greater access to improved farming inputs, and government initiatives promoting sustainable and productive cultivation are further strengthening the regional market. The combination of a large agricultural base and ongoing transition toward more efficient crop nutrition practices is expected to sustain the region's strong market position and growth momentum.
| Parameter | North America | Asia Pacific | Europe | Latin America | MEA |
|---|---|---|---|---|---|
| Innovation Hub i Scale Nascent Developing Advanced | |||||
| Cost-Sensitive Region i Scale Low Medium High | |||||
| Regulatory Environment i Scale Restrictive Neutral Supportive | |||||
| Demand Drivers i Scale Weak Moderate Strong | |||||
| Development Stage i Scale Emerging Developing Developed | |||||
| Adoption Rate i Scale Low Medium High | |||||
| New Entrants / Startups i Scale Sparse Moderate Dense | |||||
| Macro Indicators i Scale Weak Stable Strong |
Key Country Insights
Germany 🇩🇪
Efficient Input ManagementGermany prioritizes efficient nutrient utilization to support sustainable agricultural production and regulatory compliance. Crop micronutrient providers in Germany expand advanced formulations that improve nutrient availability while reducing unnecessary fertilizer application.
France 🇫🇷
Sustainable Soil NutritionFrance promotes balanced soil nutrition and responsible fertilizer management within the crop micronutrients market. Companies in France increasingly offer targeted micronutrient products that complement sustainable farming practices and improve crop quality.
Italy 🇮🇹
Horticultural Productivity FocusItaly emphasizes crop micronutrients for fruit, vegetable, and vineyard cultivation where consistent nutrient management is essential. Suppliers in Italy develop specialized nutrient blends that support quality production across diverse agricultural systems.
Japan 🇯🇵
High-Value Crop SupportJapan focuses on micronutrient solutions tailored for intensive cultivation and high-value horticultural production. Manufacturers in Japan emphasize formulation quality, application efficiency, and compatibility with modern farming practices.
South Korea 🇰🇷
Specialty Fertilizer DevelopmentSouth Korea advances crop micronutrients through specialty fertilizer technologies designed for efficient nutrient uptake. Agricultural suppliers in South Korea support growers with customized products that address crop-specific nutritional requirements and soil conditions.
United States 🇺🇸
Precision Nutrition PracticesThe U.S. crop micronutrients market benefits from precision agriculture practices that optimize nutrient application and improve crop productivity. Suppliers in the U.S. develop specialized formulations supported by soil analysis and digital farm management technologies.
Segment Leadership and Growth Trends
Crop Micronutrients Market Share (%), by Form, 2026
Go beyond the chart, access full insights & data tables
Request Free Sample ReportForm Segment Analysis: Chelated (Largest Segment) vs Non-Chelated (Fastest-Growing Segment)
Chelated crop micronutrients dominated the crop micronutrients market with a 67.9% share in 2026, supported by their ability to improve the availability and uptake of essential micronutrients by plants. Chelation helps protect nutrients from becoming unavailable in soil, enabling more efficient delivery of elements required for healthy plant development. Their effectiveness in addressing micronutrient deficiencies, particularly under challenging soil conditions, is encouraging adoption among growers seeking improved nutrient-use efficiency and more consistent crop performance.
Non-Chelated crop micronutrients are growing at the fastest pace as farmers increasingly seek accessible and cost-effective approaches to correcting nutrient deficiencies. These formulations can provide essential micronutrients through established soil and foliar application practices and remain suitable for a broad range of agricultural systems. Increasing awareness of micronutrient management, the need to improve crop productivity, and expanding efforts to optimize fertilizer use are supporting greater adoption of non-chelated formulations.
Application Segment Analysis: Soil (Largest Segment) vs Fertigation (Fastest-Growing Segment)
Soil applications represented the largest share of the crop micronutrients market at 63.05% in 2026, reflecting the widespread use of soil-based nutrient management for correcting deficiencies and maintaining plant nutrition throughout the growing cycle. Applying micronutrients through soil allows nutrients to be incorporated into established fertilization practices and can support nutrient availability around plant root zones. Growing emphasis on balanced crop nutrition, soil health, and improved agricultural productivity continues to reinforce demand for soil-applied micronutrients.
Fertigation is advancing at the fastest rate as growers increasingly integrate nutrient application with irrigation systems to improve precision and resource efficiency. Fertigation enables micronutrients to be delivered directly through irrigation water, supporting more controlled nutrient distribution and reducing unnecessary application. The expansion of efficient irrigation practices, increasing adoption of precision agriculture, and growing focus on optimizing fertilizer and water use are accelerating demand for fertigation-based micronutrient applications.
| Segment | Sub-Segment | Largest Segment | Fastest Growing |
|---|---|---|---|
| Form | Chelated, Non-Chelated | Chelated | Non-Chelated |
| Application | Soil, Foliar, Fertigation, Others | Soil | Fertigation |
| Crop Type | Cereals & Grains, Fruits & Vegetables, Pulses & Oilseeds, Others | Cereals & Grains | Fruits & Vegetables |
| Type | Zinc, Boron, Iron, Manganese, Molybdenum, Copper, Others | Copper | Zinc |
Competitive Landscape and Market Positioning
Major players in the crop micronutrients market:
1. BASF SE (Germany)
2. Nutrien Ltd. (Canada)
3. Corteva Agriscience Inc. (U.S.)
4. Yara International ASA (Norway)
5. The Mosaic Company (U.S.)
6. Nufarm Limited (Australia)
7. Nouryon Holding B.V. (Netherlands)
8. Compass Minerals International Inc. (U.S.)
9. Western Nutrients Corporation (U.S.)
10. Syngenta AG (Switzerland)
The crop micronutrients market is expanding due to increasing focus on agricultural productivity and soil health enhancement. Innovation in nutrient delivery systems is improving crop yield efficiency. Development of tailored formulations for specific soil conditions is rising, while technological integration supports precision agriculture practices.
| Company | Market Share | Company Revenue | Revenue CAGR (%) | Product Portfolio | Geographic Presence | Innovation / R&D Focus | Strategic Developments |
|---|---|---|---|---|---|---|---|
| BASF SE (Germany) | |||||||
| Nutrien Ltd. (Canada) | |||||||
| Corteva Agriscience Inc. (U.S.) | |||||||
| Yara International ASA (Norway) | |||||||
| The Mosaic Company (U.S.) | |||||||
| Nufarm Limited (Australia) | |||||||
| Nouryon Holding B.V. (Netherlands) | |||||||
| Compass Minerals International Inc. (U.S.) | |||||||
| Western Nutrients Corporation (U.S.) | |||||||
| Syngenta AG (Switzerland). |
Industry Development/News
| Company Name | Date | Key Development |
|---|---|---|
| Ecorobotix | May-26 | Ecorobotix is driving technological advancement in the crop micronutrients market through the integration of AI-powered nutrient deficiency detection and precision spraying systems. This innovation enhances nutrient-use efficiency and reduces agricultural input waste, directly supporting the industry shift toward sustainable and precision farming practices by optimizing the delivery of essential micronutrients to crops. |
| John Deere | May-26 | John Deere is advancing the digital transformation of crop micronutrient application via precision agriculture technologies. By integrating AI-based analytics with advanced application systems, the company provides solutions for improved soil nutrient management and enhanced fertilizer efficiency. These developments facilitate data-driven farming practices aimed at maximizing crop productivity while minimizing environmental impact through precise nutrient placement. |
| Microsoft | May-26 | Microsoft is enabling significant innovation in the crop micronutrients sector by deploying AI models and digital twin technologies. These digital tools provide enhanced capabilities for crop nutrient monitoring and predictive analysis, allowing for more precise fertilizer application. By leveraging these technologies, agricultural operations can better optimize nutrient delivery, reduce environmental footprints, and improve overall field productivity. |
Customize Your Report
Explore examples of how this report can be tailored to different research needs, including custom segments, additional topics or chapters, and related reports. Click a section of the wheel or its numbered marker to explore the available options.
Crop Micronutrients Market — Custom Segments
| Segment | Sub-Segment |
|---|---|
| Farming Method | Conventional Farming, Organic Farming, Precision Agriculture, Protected Agriculture |
| Farm Size | Small Farms, Medium Farms, Large Farms, Commercial Agribusinesses |
| Distribution Channel | Direct Sales, Agricultural Cooperatives, Specialty Retailers, Distributors & Dealers, E-Commerce |
Crop Micronutrients Market — Custom TOC
| Custom Chapter | Custom Details |
|---|---|
| Precision Agriculture and Micronutrient Application Opportunities |
|
| Soil Health and Sustainable Crop Nutrition |
|
| Farmer Adoption Barriers and Market Development Opportunities |
|
Need a different cut of the data?
Request Custom ResearchWhat is the market valuation of crop micronutrients?
How much is the crop micronutrients industry expected to grow by 2036?
Which operational trends are accelerating adoption of crop micronutrients across modern farming systems?
How are food security priorities influencing purchasing decisions in the crop micronutrients market?
Why do chelated micronutrients lead the crop micronutrients market?
Which application segment is growing the fastest in the crop micronutrients market?
Why does Asia Pacific lead the crop micronutrients market?
What is fueling growth in the Asia Pacific crop micronutrients market?
Which companies dominate the crop micronutrients landscape?
Our Clients
"The report helped us understand emerging consumer trends in our product category. It clarified where to focus innovation for the next product launch."
LyondellBasell
"The regional forecast section was incredibly useful. We were able to identify two new potential partners in Europe thanks to the vendor mapping you included."
SABIC
"We appreciated how actionable the recommendations were. It guided us to improve supply chain resilience."
Olin Corporation
Our Research Team & Methodology
Every Fundamental Business Insights report is built by a dedicated vertical research team, validated through a structured primary-and-secondary methodology, and reviewed for accuracy before it reaches you.
Research Team Overview
Prepared by the Chemicals & Materials Research Team
Delivery
Published
Demand
Available
Support
Trust & Compliance
Research Domains
10 coverage areasResearch Intelligence
| Source | Reference |
|---|---|
| American Chemistry Council (ACC) | www.americanchemistry.com |
| European Chemical Industry Council (Cefic) | cefic.org |
| International Council of Chemical Associations (ICCA) | icca-chem.org |
| European Chemicals Agency (ECHA) | echa.europa.eu |
| U.S. Environmental Protection Agency (EPA) | www.epa.gov |
| ASTM International | www.astm.org |
| International Organization for Standardization (ISO) | www.iso.org |
| National Institute of Standards and Technology (NIST) | www.nist.gov |
| Plastics Industry Association (PLASTICS) | www.plasticsindustry.org |
| European Biplastics | www.european-bioplastics.org |
| The Adhesive and Sealant Council (ASC) | www.ascouncil.org |
| National Association of Corrosion Engineers (AMPP) | www.ampp.org |
| Society of Plastics Engineers (SPE) | www.4spe.org |
| International Fertilizer Association (IFA) | www.fertilizer.org |
| CropLife International | croplife.org |
| Packaging Europe | packagingeurope.com |
| Flexible Packaging Association (FPA) | www.flexpack.org |
| Battery Council International (BCI) | batterycouncil.org |
| International Copper Association (ICA) | internationalcopper.org |
| World Steel Association | worldsteel.org |
Research Workflow & Quality Assurance
Data Collection
Verified information gathered through primary and secondary research.
Data Triangulation
Cross-validation using multiple independent data sources.
Forecast Modelling
Market estimates developed using historical trends and analytical models.
Analyst Validation
Findings reviewed by domain experts for accuracy and consistency.
Editorial & Quality Review
Final editorial, quality, and compliance checks before publication.
Final Publication
Released after successful completion of the internal review process.
Report Coverage
📊 Market Assessment
- Market Size & Forecast
- Market Segmentation
- Regional Analysis
- Growth Drivers & Challenges
- Market Dynamics
🏢 Competitive Intelligence
- Competitive Landscape
- Company Profiles
- Competitive Benchmarking
- Mergers & Acquisitions
- Market Share Analysis or Key Company Strategies
🔍 Strategic Analysis
- Value Chain Analysis
- Porter's Five Forces
- PESTLE Analysis
- Pricing Trends
- Supply-Demand Analysis
🚀 Future Outlook
- Technology Landscape
- Regulatory Landscape
- Investment & Funding Landscape
- Emerging Opportunities
- Future Market Outlook
Have a question about this report or need a custom scope?
Request Customization