Biological Data Visualization Market Size & Growth Forecast 2027–2036, By Segments (Platform, End-use, Technique, Application), Regional Demand Trends (North America, Asia Pacific, Europe), Key Country Insights (U.S., Japan, South Korea, Germany, France, Italy), and Competitive Landscape
Market Size and Growth Outlook
Biological Data Visualization Market size was valued at USD 735 million in 2026 and is anticipated to grow at a 8.08% CAGR from 2027 to 2036, exceeding USD 1.6 billion by 2036. The industry revenue for 2027 is calculated at USD 784.98 million.
Get more details on this report
Request Free Sample ReportBiological Data Visualization Market Intelligence Snapshot
Regional Market Dynamics
- North America leads with 45.96% share due to strong life sciences research base, widespread bioinformatics adoption, and integration into genomics and clinical research workflows.
- Asia Pacific is expanding at 9.61% CAGR, supported by rising biotechnology investment, increasing sequencing data generation, and adoption of advanced bioinformatics visualization tools.
Segment Momentum
- Academic Research accounted for 67.37% of the market in 2026 due to continuous demand for visualization tools that support analysis, collaboration, and publication of large biological datasets across research institutions.
- Mac OS is the fastest-growing platform as researchers increasingly prefer integrated hardware-software environments that deliver responsive performance and streamlined workflows for complex biological data visualization tasks.
Market Expansion Drivers
- Rapid expansion of biological big data and AI-driven bioinformatics accelerating data interpretation.
- Growth in genomics and proteomics research generating large-scale complex biological datasets.
- Cloud-based collaborative platforms enabling large-scale biomedical data sharing and visualization.
Leading Market Participants
- Leading players in the biological data visualization market include Thermo Fisher Scientific Inc. (USA), QIAGEN N.V. (Germany), Agilent Technologies, Inc. (USA), Tableau Software, LLC (USA), ZEISS Group (Germany), Oxford Instruments plc (United Kingdom), Olympus Corporation (Japan), Clarivate Plc (United Kingdom).
Global Market Forecast Snapshot
Market Outlook
- 2026 Market Size: USD 735 million
- 2027 Estimated Market Size: USD 784.98 million.
- Projected Market Size: USD 1.6 billion by 2036
- Growth Forecast: 8.08% CAGR (2027-2036)
Regional and Segment Outlook
- Leading Regional Market: North America
- High-Growth Regional Hub: Asia Pacific
- Core Revenue Segment: Windows (Platform) | Academic Research (End-use) | Sequencing (Technique) | Cell and Organism Imaging (Application)
- Emerging Opportunity Segment: Mac OS (Platform) | Pharmaceutical & Biotechnology Companies (End-use) | Magnetic Resonance Imaging (Technique) | Genomic Analysis (Application)
Market Growth Drivers and Industry Trends
Rapid expansion of biological big data and AI-driven bioinformatics accelerating data interpretation
The biological data visualization market is gaining momentum as the rapid expansion of biological big data creates a growing need for tools that can transform complex datasets into interpretable visual outputs. AI-driven bioinformatics is increasingly being applied to identify patterns, correlations, and biological relationships across large volumes of genomic, molecular, and clinical information, making advanced visualization capabilities important for researchers and data analysts. As computational methods become more sophisticated, visualization platforms help users explore multidimensional datasets, compare biological variables, and interpret AI-generated findings through interactive charts, molecular structures, network maps, and other visual representations. The increasing use of machine learning in biological research is also generating demand for visualization solutions capable of presenting complex analytical results in an accessible form for scientific investigation and decision-making.
Growth in genomics and proteomics research generating large-scale complex biological datasets
Expanding genomics and proteomics research is creating substantial volumes of complex biological information, which is supporting demand in the biological data visualization market. Researchers working with sequencing data, protein interactions, molecular pathways, and biomarker profiles require visualization tools to examine relationships that may be difficult to identify through conventional data formats. Visualization platforms enable researchers to organize multidimensional biological information, compare datasets, identify patterns, and investigate interactions across genes and proteins. The increasing focus on precision medicine, functional genomics, and molecular biology is further broadening the range of datasets generated during research activities, while interactive visualization capabilities allow scientific teams to interpret these datasets more efficiently during exploratory analysis and experimental validation.
Cloud-based collaborative platforms enabling large-scale biomedical data sharing and visualization
The biological data visualization market is benefiting from the increasing use of cloud-based platforms that allow biomedical datasets to be accessed, analyzed, and visualized across distributed research environments. Cloud infrastructure supports the storage and processing of large biological datasets without requiring every research organization to maintain extensive local computing resources, while collaborative visualization environments enable researchers to work with shared datasets and analytical outputs. These capabilities are particularly relevant for multidisciplinary biomedical projects in which scientists, clinicians, bioinformaticians, and data analysts may need to review the same information from different locations. Integration of cloud computing with interactive visualization can also simplify dataset management, facilitate remote collaboration, and support the analysis of increasingly complex biomedical information.
| Growth Driver | Impact on CAGR | Regulatory Influence | Geographic Relevance | Adoption Rate | Impact Timeline |
|---|---|---|---|---|---|
| Rapid expansion of biological big data and AI-driven bioinformatics accelerating data interpretation | 2.60% | Moderate | North America, Europe | High | Near Term |
| Growth in genomics and proteomics research generating large-scale complex biological datasets | 2.20% | High | North America, Europe | High | Mid Term |
| Cloud-based collaborative platforms enabling large-scale biomedical data sharing and visualization | 1.80% | Moderate | North America, Asia Pacific | Medium | Mid Term |
Unlock insights tailored to your business with our bespoke market research solutions.
Click to get your customized report now.
Regional Demand Dynamics
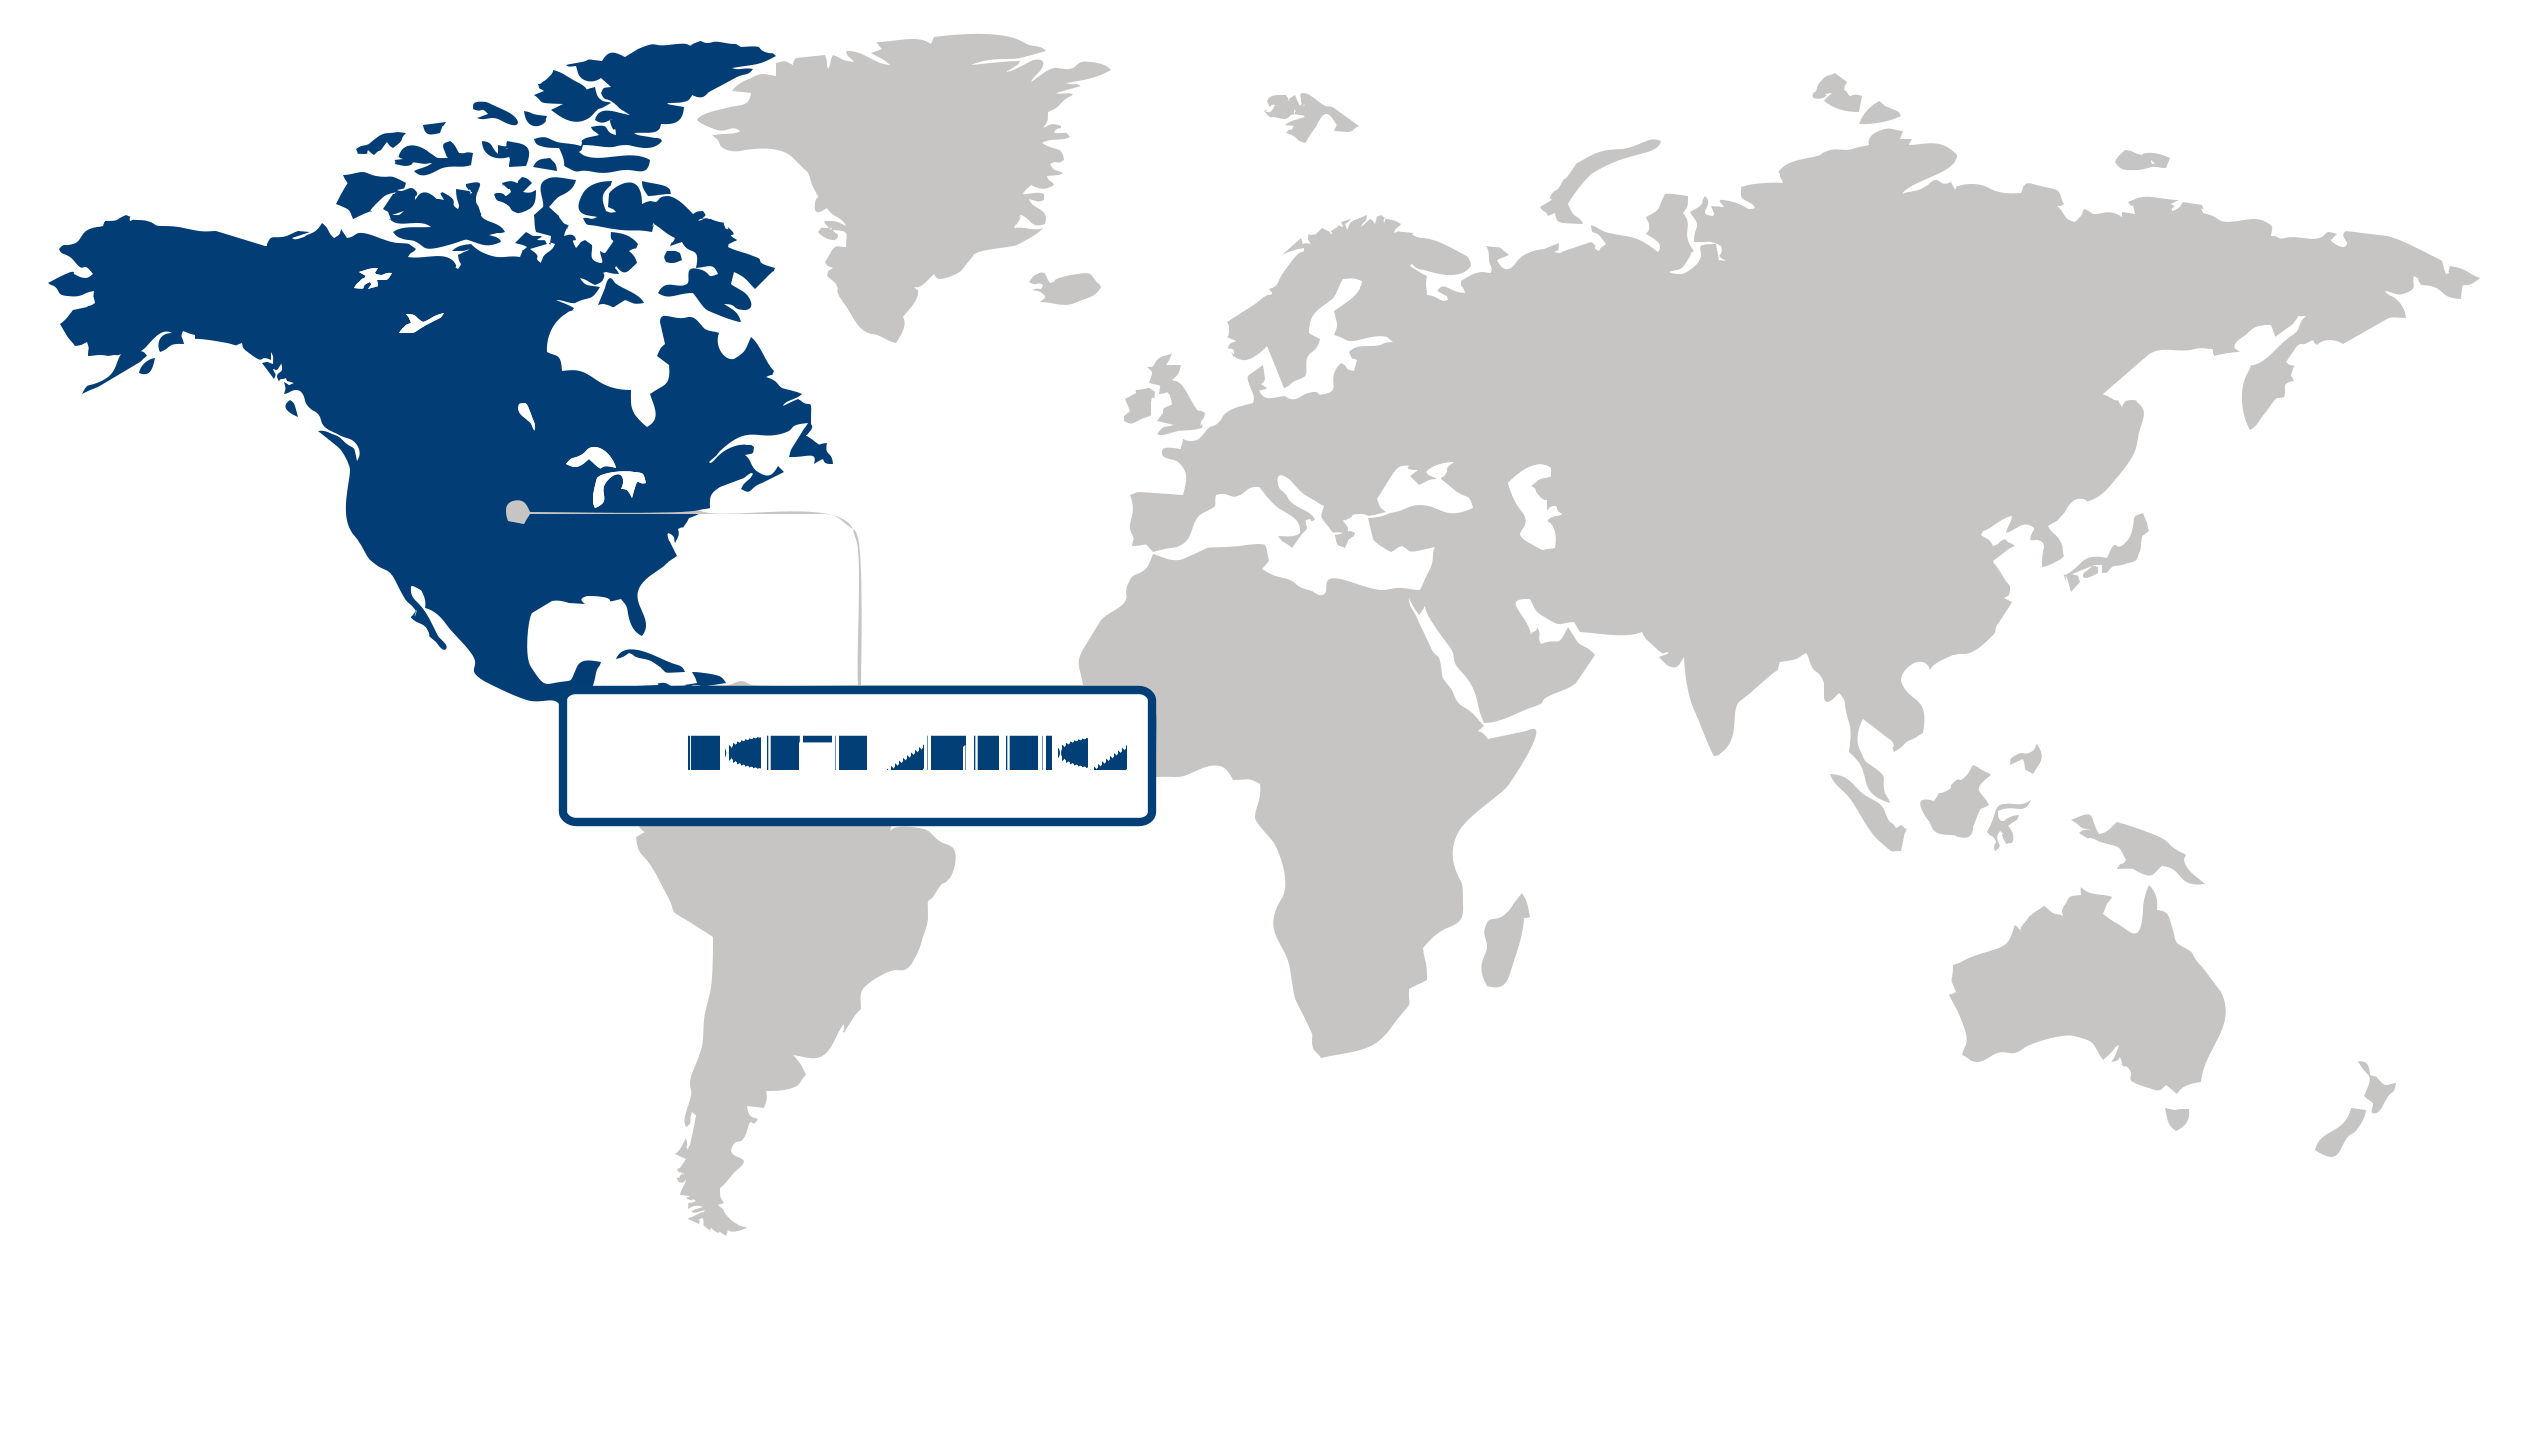
North America (Largest Region)
In the biological data visualization market, North America held the largest share of 45.96% in 2026, supported by its advanced life sciences ecosystem, strong research infrastructure, and widespread adoption of data-intensive analytical technologies. The region benefits from extensive biological research activities across genomics, proteomics, drug discovery, and clinical research, creating sustained demand for sophisticated visualization platforms that can translate complex datasets into actionable insights. Established digital infrastructure, high investment in scientific computing, and growing integration of artificial intelligence and advanced analytics further strengthen the adoption of visualization solutions. In addition, collaboration between research institutions, healthcare organizations, and technology providers supports continuous innovation and broader application of biological data visualization tools.
Asia Pacific (Fastest-Growing Region)
Asia Pacific is positioned as the fastest-growing regional market, driven by expanding biotechnology and pharmaceutical research, increasing healthcare digitization, and rising investment in scientific infrastructure. The region's growing focus on genomics, precision medicine, and data-driven life sciences is increasing the need for tools capable of processing and interpreting complex biological information. Improvements in research capabilities, digital connectivity, and computational resources are also enabling wider adoption beyond established research centers. As organizations across healthcare and biotechnology increasingly emphasize efficient data interpretation and collaborative research workflows, demand for advanced visualization technologies is expected to gain further momentum.
| Parameter | North America | Asia Pacific | Europe | Latin America | MEA |
|---|---|---|---|---|---|
| Innovation Hub i Scale Nascent Developing Advanced | |||||
| Cost-Sensitive Region i Scale Low Medium High | |||||
| Regulatory Environment i Scale Restrictive Neutral Supportive | |||||
| Demand Drivers i Scale Weak Moderate Strong | |||||
| Development Stage i Scale Emerging Developing Developed | |||||
| Adoption Rate i Scale Low Medium High | |||||
| New Entrants / Startups i Scale Sparse Moderate Dense | |||||
| Macro Indicators i Scale Weak Stable Strong |
Key Country Insights
Germany 🇩🇪
Bioinformatics Workflow SupportGermany emphasizes biological data visualization tools that integrate smoothly with established bioinformatics workflows across research institutions and biotechnology organizations. The market favors solutions that improve data interpretation while maintaining scientific accuracy and reproducibility.
France 🇫🇷
Collaborative Life Science ToolsFrance prioritizes biological data visualization solutions that enable collaborative analysis across academic research centers, healthcare institutions, and biotechnology organizations. The market values platforms that improve accessibility to complex biological datasets while supporting multidisciplinary research projects.
Italy 🇮🇹
Translational Research EnablementItaly increasingly adopts biological data visualization technologies that support translational research and biomedical innovation across universities and healthcare laboratories. Visualization platforms are selected for their ability to convert complex biological information into actionable research insights.
Japan 🇯🇵
Precision Research VisualizationJapan continues adopting biological data visualization technologies that support precision medicine, molecular research, and advanced life science applications. Visualization platforms are increasingly expected to present complex datasets through intuitive and research-friendly interfaces.
South Korea 🇰🇷
AI-Enabled Data ExplorationSouth Korea is expanding biological data visualization capabilities alongside growing use of artificial intelligence in biomedical research. Organizations seek visualization platforms that help researchers interpret large biological datasets efficiently and strengthen collaborative scientific analysis.
United States 🇺🇸
Research Analytics PlatformThe U.S. biological data visualization market is driven by demand for platforms that simplify interpretation of complex genomics, proteomics, and multi-omics datasets. Organizations prioritize scalable visualization capabilities that enhance collaborative biomedical research and data-driven discovery.
Segment Leadership and Growth Trends
Biological Data Visualization Market Share (%), by Platform, 2026
Go beyond the chart, access full insights & data tables
Request Free Sample ReportPlatform Segment Analysis: Windows (Largest Segment) vs Mac OS (Fastest-Growing Segment)
The windows segment dominated the biological data visualization market with a 67.49% share in 2026, supported by its broad use across research, laboratory, and data-intensive scientific computing environments. Its established presence in institutional settings and compatibility with a wide range of analytical and visualization workflows make it a practical platform for processing and interpreting complex biological datasets. Continued reliance on familiar computing infrastructure and established software environments further strengthens its adoption among researchers and scientific organizations.
Mac OS is gaining momentum as researchers and life science professionals increasingly adopt flexible computing environments for advanced data analysis and visualization. Its appeal is supported by demand for efficient graphical interfaces and computing platforms capable of handling sophisticated scientific workflows. As biological research becomes increasingly data-intensive, the growing need for accessible and user-friendly visualization tools is contributing to greater adoption of mac OS-based environments.
End-use Segment Analysis: Academic Research (Largest Segment) vs Pharmaceutical & Biotechnology Companies (Fastest-Growing Segment)
Academic research accounted for a 67.37% share of the biological data visualization market in 2026, reflecting the extensive use of visualization tools in universities and research institutions for interpreting complex biological information. Researchers rely on graphical representations to identify patterns, examine relationships, and communicate findings across areas such as genomics, molecular biology, and other data-driven disciplines. The increasing generation of biological datasets and continued emphasis on computational research are reinforcing the importance of visualization platforms within academic environments.
Pharmaceutical & biotechnology companies are driving faster adoption as drug discovery, biomarker research, and biological analysis become increasingly dependent on complex datasets. Visualization capabilities help these organizations interpret experimental results, identify meaningful biological patterns, and support data-driven research decisions. The growing integration of computational methods into life science development is therefore strengthening demand for specialized visualization solutions within commercial research environments.
| Segment | Sub-Segment | Largest Segment | Fastest Growing |
|---|---|---|---|
| Platform | Windows, Mac OS, Linux, Others | Windows | Mac OS |
| End-use | Academic Research, Pharmaceutical & Biotechnology Companies, Hospitals & Clinics, Others | Academic Research | Pharmaceutical & Biotechnology Companies |
| Technique | Microscopy, Magnetic Resonance Imaging, Sequencing, X-ray Crystallography, Others | Sequencing | Magnetic Resonance Imaging |
| Application | Cell and Organism Imaging, Structural Biology and Molecular Modeling, Genomic Analysis, Alignments, Phylogeny, and Evolution, Systems Biology | Cell and Organism Imaging | Genomic Analysis |
Competitive Landscape and Market Positioning
Key companies in the biological data visualization market:
1. Thermo Fisher Scientific Inc. (USA)
2. QIAGEN N.V. (Germany)
3. Agilent Technologies Inc. (USA)
4. Tableau Software LLC (USA)
5. ZEISS Group (Germany)
6. Oxford Instruments plc (United Kingdom)
7. Olympus Corporation (Japan)
8. Clarivate Plc (United Kingdom)
The biological data visualization market is expanding through growing demand for interactive analytics platforms, genomic interpretation tools, and AI-supported visualization technologies. Companies are emphasizing user-friendly interfaces and scalable data integration systems to simplify complex biological analysis workflows. Cross-disciplinary collaborations between life sciences and data analytics specialists are also accelerating innovation within the biological data visualization market.
| Company | Market Share | Company Revenue | Revenue CAGR (%) | Product Portfolio | Geographic Presence | Innovation / R&D Focus | Strategic Developments |
|---|---|---|---|---|---|---|---|
| Thermo Fisher Scientific Inc. (USA) | |||||||
| QIAGEN N.V. (Germany) | |||||||
| Agilent Technologies Inc. (USA) | |||||||
| Tableau Software LLC (USA) | |||||||
| ZEISS Group (Germany) | |||||||
| Oxford Instruments plc (United Kingdom) | |||||||
| Olympus Corporation (Japan) | |||||||
| Clarivate Plc (United Kingdom). |
Industry Development/News
| Company Name | Date | Key Development |
|---|---|---|
| Sophia Genetics | May-24 | Sophia Genetics partnered with Microsoft and NVIDIA to develop advanced solutions for whole genome sequencing (WGS) analysis. The collaboration integrates genomic expertise with high-performance computing and AI infrastructure to improve large-scale genomic data processing and enable more efficient interpretation of complex biological datasets. |
| Parse Biosciences | May-24 | Parse Biosciences launched Trailmaker, a cloud-based platform for single-cell data analysis designed to support scalable and streamlined biological data interpretation. The platform addresses computational bottlenecks in single-cell sequencing workflows, enabling faster conversion of raw sequencing outputs into structured, actionable biological insights for research applications. |
Customize Your Report
Explore examples of how this report can be tailored to different research needs, including custom segments, additional topics or chapters, and related reports. Click a section of the wheel or its numbered marker to explore the available options.
Biological Data Visualization Market — Custom Segments
| Segment | Sub-Segment |
|---|---|
| Deployment Model | On-Premise, Cloud-Based, Hybrid |
| Organization Size | Large Enterprises, Mid-Sized Organizations, Small Organizations |
| Licensing Model | Subscription-Based, Perpetual License, Usage-Based |
Biological Data Visualization Market — Custom TOC
| Custom Chapter | Custom Details |
|---|---|
| Research Informatics Adoption and Investment Assessment |
|
| AI-Driven Visualization Platform Benchmarking |
|
| Life Sciences Data Integration Ecosystem |
|
Need a different cut of the data?
Request Custom ResearchWhat is the current revenue of the biological data visualization market?
How much is the biological data visualization industry expected to grow by 2036?
How is AI-driven bioinformatics influencing demand for biological data visualization platforms?
Why are cloud-based visualization platforms gaining strategic importance in biological research?
Why is academic research the largest end-use segment in the biological data visualization market?
Which platform is emerging as the fastest-growing in the biological data visualization market?
Why does North America lead the biological data visualization market?
What is driving Asia Pacific growth in biological data visualization?
Which companies are driving growth in the biological data visualization landscape?
Our Clients
"The team took the time to understand our specific business needs and delivered a report that was well aligned with our objectives. Their expertise and understanding of the industry were clearly reflected in the quality and relevance of the insights provided."
Siemens Healthcare
"Our experience in acquiring the research report has been excellent. The depth of analysis, and actionable insights provided have been extremely valuable in supporting our ongoing R&D efforts."
GC Biopharma
"The report offered a comprehensive view of the market trends. The in-depth segmentation and analysis of emerging opportunities gave us a better understanding of the market."
Medtronic
Our Research Team & Methodology
Every Fundamental Business Insights report is built by a dedicated vertical research team, validated through a structured primary-and-secondary methodology, and reviewed for accuracy before it reaches you.
Research Team Overview
Prepared by the Healthcare & Medical Devices Research Team
Delivery
Published
Demand
Available
Support
Trust & Compliance
Research Domains
10 coverage areasResearch Intelligence
| Source | Reference |
|---|---|
| World Health Organization (WHO) | www.who.int |
| U.S. Food & Drug Administration (FDA) | www.fda.gov |
| European Medicines Agency (EMA) | www.ema.europa.eu |
| Centers for Disease Control and Prevention (CDC) | www.cdc.gov |
| National Institutes of Health (NIH) | www.nih.gov |
| National Center for Biotechnology Information (NCBI) | www.ncbi.nlm.nih.gov |
| PubMed | pubmed.ncbi.nlm.nih.gov |
| ClinicalTrials.gov | clinicaltrials.gov |
| International Organization for Standardization (ISO) | www.iso.org |
| ASTM International | www.astm.org |
| Advanced Medical Technology Association (AdvaMed) | www.advamed.org |
| Medical Device Innovation Consortium (MDIC) | mdic.org |
| Biotechnology Innovation Organization (BIO) | www.bio.org |
| International Federation of Pharmaceutical Manufacturers & Associations (IFPMA) | www.ifpma.org |
| U.S. Pharmacopeia (USP) | www.usp.org |
| European Directorate for the Quality of Medicines & HealthCare (EDQM) | www.edqm.eu |
| World Organisation for Animal Health (WOAH) | www.woah.org |
| American Hospital Association (AHA) | www.aha.org |
| OECD Health | www.oecd.org/health |
| World Bank Data | data.worldbank.org |
Research Workflow & Quality Assurance
Data Collection
Verified information gathered through primary and secondary research.
Data Triangulation
Cross-validation using multiple independent data sources.
Forecast Modelling
Market estimates developed using historical trends and analytical models.
Analyst Validation
Findings reviewed by domain experts for accuracy and consistency.
Editorial & Quality Review
Final editorial, quality, and compliance checks before publication.
Final Publication
Released after successful completion of the internal review process.
Report Coverage
📊 Market Assessment
- Market Size & Forecast
- Market Segmentation
- Regional Analysis
- Growth Drivers & Challenges
- Market Dynamics
🏢 Competitive Intelligence
- Competitive Landscape
- Company Profiles
- Competitive Benchmarking
- Mergers & Acquisitions
- Market Share Analysis or Key Company Strategies
🔍 Strategic Analysis
- Value Chain Analysis
- Porter's Five Forces
- PESTLE Analysis
- Pricing Trends
- Supply-Demand Analysis
🚀 Future Outlook
- Technology Landscape
- Regulatory Landscape
- Investment & Funding Landscape
- Emerging Opportunities
- Future Market Outlook
Have a question about this report or need a custom scope?
Request Customization