Bio-based Naphtha Market Size & Forecasts 2026-2035, By Segments (Source, Application), Growth Opportunities, Innovation Landscape, Regulatory Shifts, Strategic Regional Insights (U.S., Japan, China, South Korea, UK, Germany, France), and Competitive Dynamics (Braskem, BASF, LyondellBasell, Shell, SABIC)
Market Size and Growth Outlook
Bio-based Naphtha Market size is expected to advance from USD 1.31 billion in 2025 to USD 5.73 billion by 2035, registering a CAGR of more than 15.9% across 2026-2035. By 2026, the industry is anticipated to generate USD 1.49 billion in revenue.
Get more details on this report
Request Free Sample ReportBio-based Naphtha Market Intelligence Snapshot
Regional Market Dynamics
Segment Momentum
Market Expansion Drivers
Leading Market Participants
Global Market Forecast Snapshot
Market Outlook
Regional and Segment Outlook
Market Growth Drivers and Industry Trends
Policy frameworks such as the European Commission's Renewable Energy Directive (RED II), the U.S. Environmental Protection Agency's Renewable Fuel Standard (RFS), and the California Air Resources Board (CARB) Low Carbon Fuel Standard are reorienting upstream demand and certification requirements, making low-carbon feedstocks commercially viable and accelerating adoption in the bio-based naphtha market. These mandates shift purchase behaviors and capital allocation, advantaging incumbents with integrated logistics while creating entry points for feedstock aggregators and certified producers. Strategic opportunities include long-term offtake contracts for established refiners and certification, traceability, and aggregation services for new entrants. Given the explicit compliance timetables and ongoing regulatory rollouts from these authorities, policy-driven demand is concretely shaping near-term commercialization paths.
Expansion of sustainable chemical production
Corporate procurement commitments and commercial-scale supply from producers such as Neste, alongside sustainability targets published by BASF and Dow, are pulling renewable hydrocarbon streams into chemical manufacturing and increasing appetite for drop-in feedstocks across the bio-based naphtha market. The European Chemical Industry Council (Cefic) roadmaps and buyer-driven sourcing pilots demonstrate a systemic shift toward renewable inputs, prompting partnerships between refiners and chemical offtakers. Established players can monetize integrated supply and certification chains, while startups can capture value through mass-balance accounting, blockchain-backed traceability, or specialty feedstock supply. With multiple corporates announcing procurement targets and pilot programs, alignment between supply capability and buyer specifications is observable and actionable.
Technological improvements in bio-naphtha refining
Progress in catalytic hydrotreatment and renewable hydrocarbon platforms—illustrated by Neste’s NEXBTL technology and process research from the National Renewable Energy Laboratory (NREL), alongside catalyst development by Clariant and Johnson Matthey—is expanding feasible feedstock mixes and lowering processing barriers in the bio-based naphtha market. These technical advances reduce retrofit complexity for existing crackers and enable new entrants to offer modular or licensed solutions. Incumbents can pursue asset conversion and technology licensing to protect margins; technology-focused firms can commercialize via joint ventures or service contracts. Given the active pipeline of pilot plants, published technical results, and vendor announcements, technological readiness is moving from lab validation toward staged commercial deployment.
Industry Restraints:
Feedstock Availability and Sustainability Constraints
Limited, heterogeneous supplies of suitable biomass and waste feedstocks are a primary restraint because bio-based naphtha production depends on specific residual oils, lignocellulosic inputs, or waste streams that are geographically dispersed and contested by other sectors. The International Energy Agency (IEA) has flagged biomass feedstock competition and sustainability limits, while Neste describes in corporate disclosures its heavy reliance on waste and residue oils and the practical limits of scaling those streams; Shell plc and TotalEnergies SE have likewise documented sourcing constraints in project releases. Strategically, this elevates the importance of long-term offtake contracts, vertical integration and feedstock partnerships—raising capital and operational requirements for new entrants and squeezing margins for incumbents. Absent major advances in feedstock collection or cellulosic conversion, supply constraints will remain a near‑to‑medium‑term cap on rapid market expansion.
Regulatory and Certification Complexity
Fragmented, evolving sustainability criteria and lifecycle accounting standards create a high-compliance barrier that slows adoption and raises operating costs. The European Commission’s Renewable Energy Directive (RED II/RED III) framework, the United States Environmental Protection Agency’s Renewable Fuel Standard, California’s Low Carbon Fuel Standard, and certification schemes such as International Sustainability and Carbon Certification (ISCC) and the Roundtable on Sustainable Biomaterials (RSB) impose differing GHG accounting rules and documentation burdens; TotalEnergies SE and Neste require strict certified feedstocks in their procurement policies. For market participants, this favors large, compliance-capable firms and disadvantages smaller innovators lacking certification resources. Expect continued tightening and jurisdictional divergence in the near term, reinforcing the advantage of firms that invest early in compliance, traceability, and transparent lifecycle reporting.
| Growth Driver | Impact on CAGR | Regulatory Influence | Geographic Relevance | Adoption Rate | Impact Timeline |
|---|---|---|---|---|---|
| Government incentives and mandates for biofuels | 5.50% | Short term (≤ 2 yrs) | North America, Europe; Spillover: Asia Pacific | High | Fast |
| Expansion of sustainable chemical production | 4.50% | Medium term (2–5 yrs) | Asia Pacific, Europe | Medium | Moderate |
| Technological improvements in bio-naphtha refining | 3.50% | Long term (5+ yrs) | North America, Asia Pacific | Medium | Slow |
Explore Growth Opportunities
Request Free Sample ReportRegional Demand Dynamics
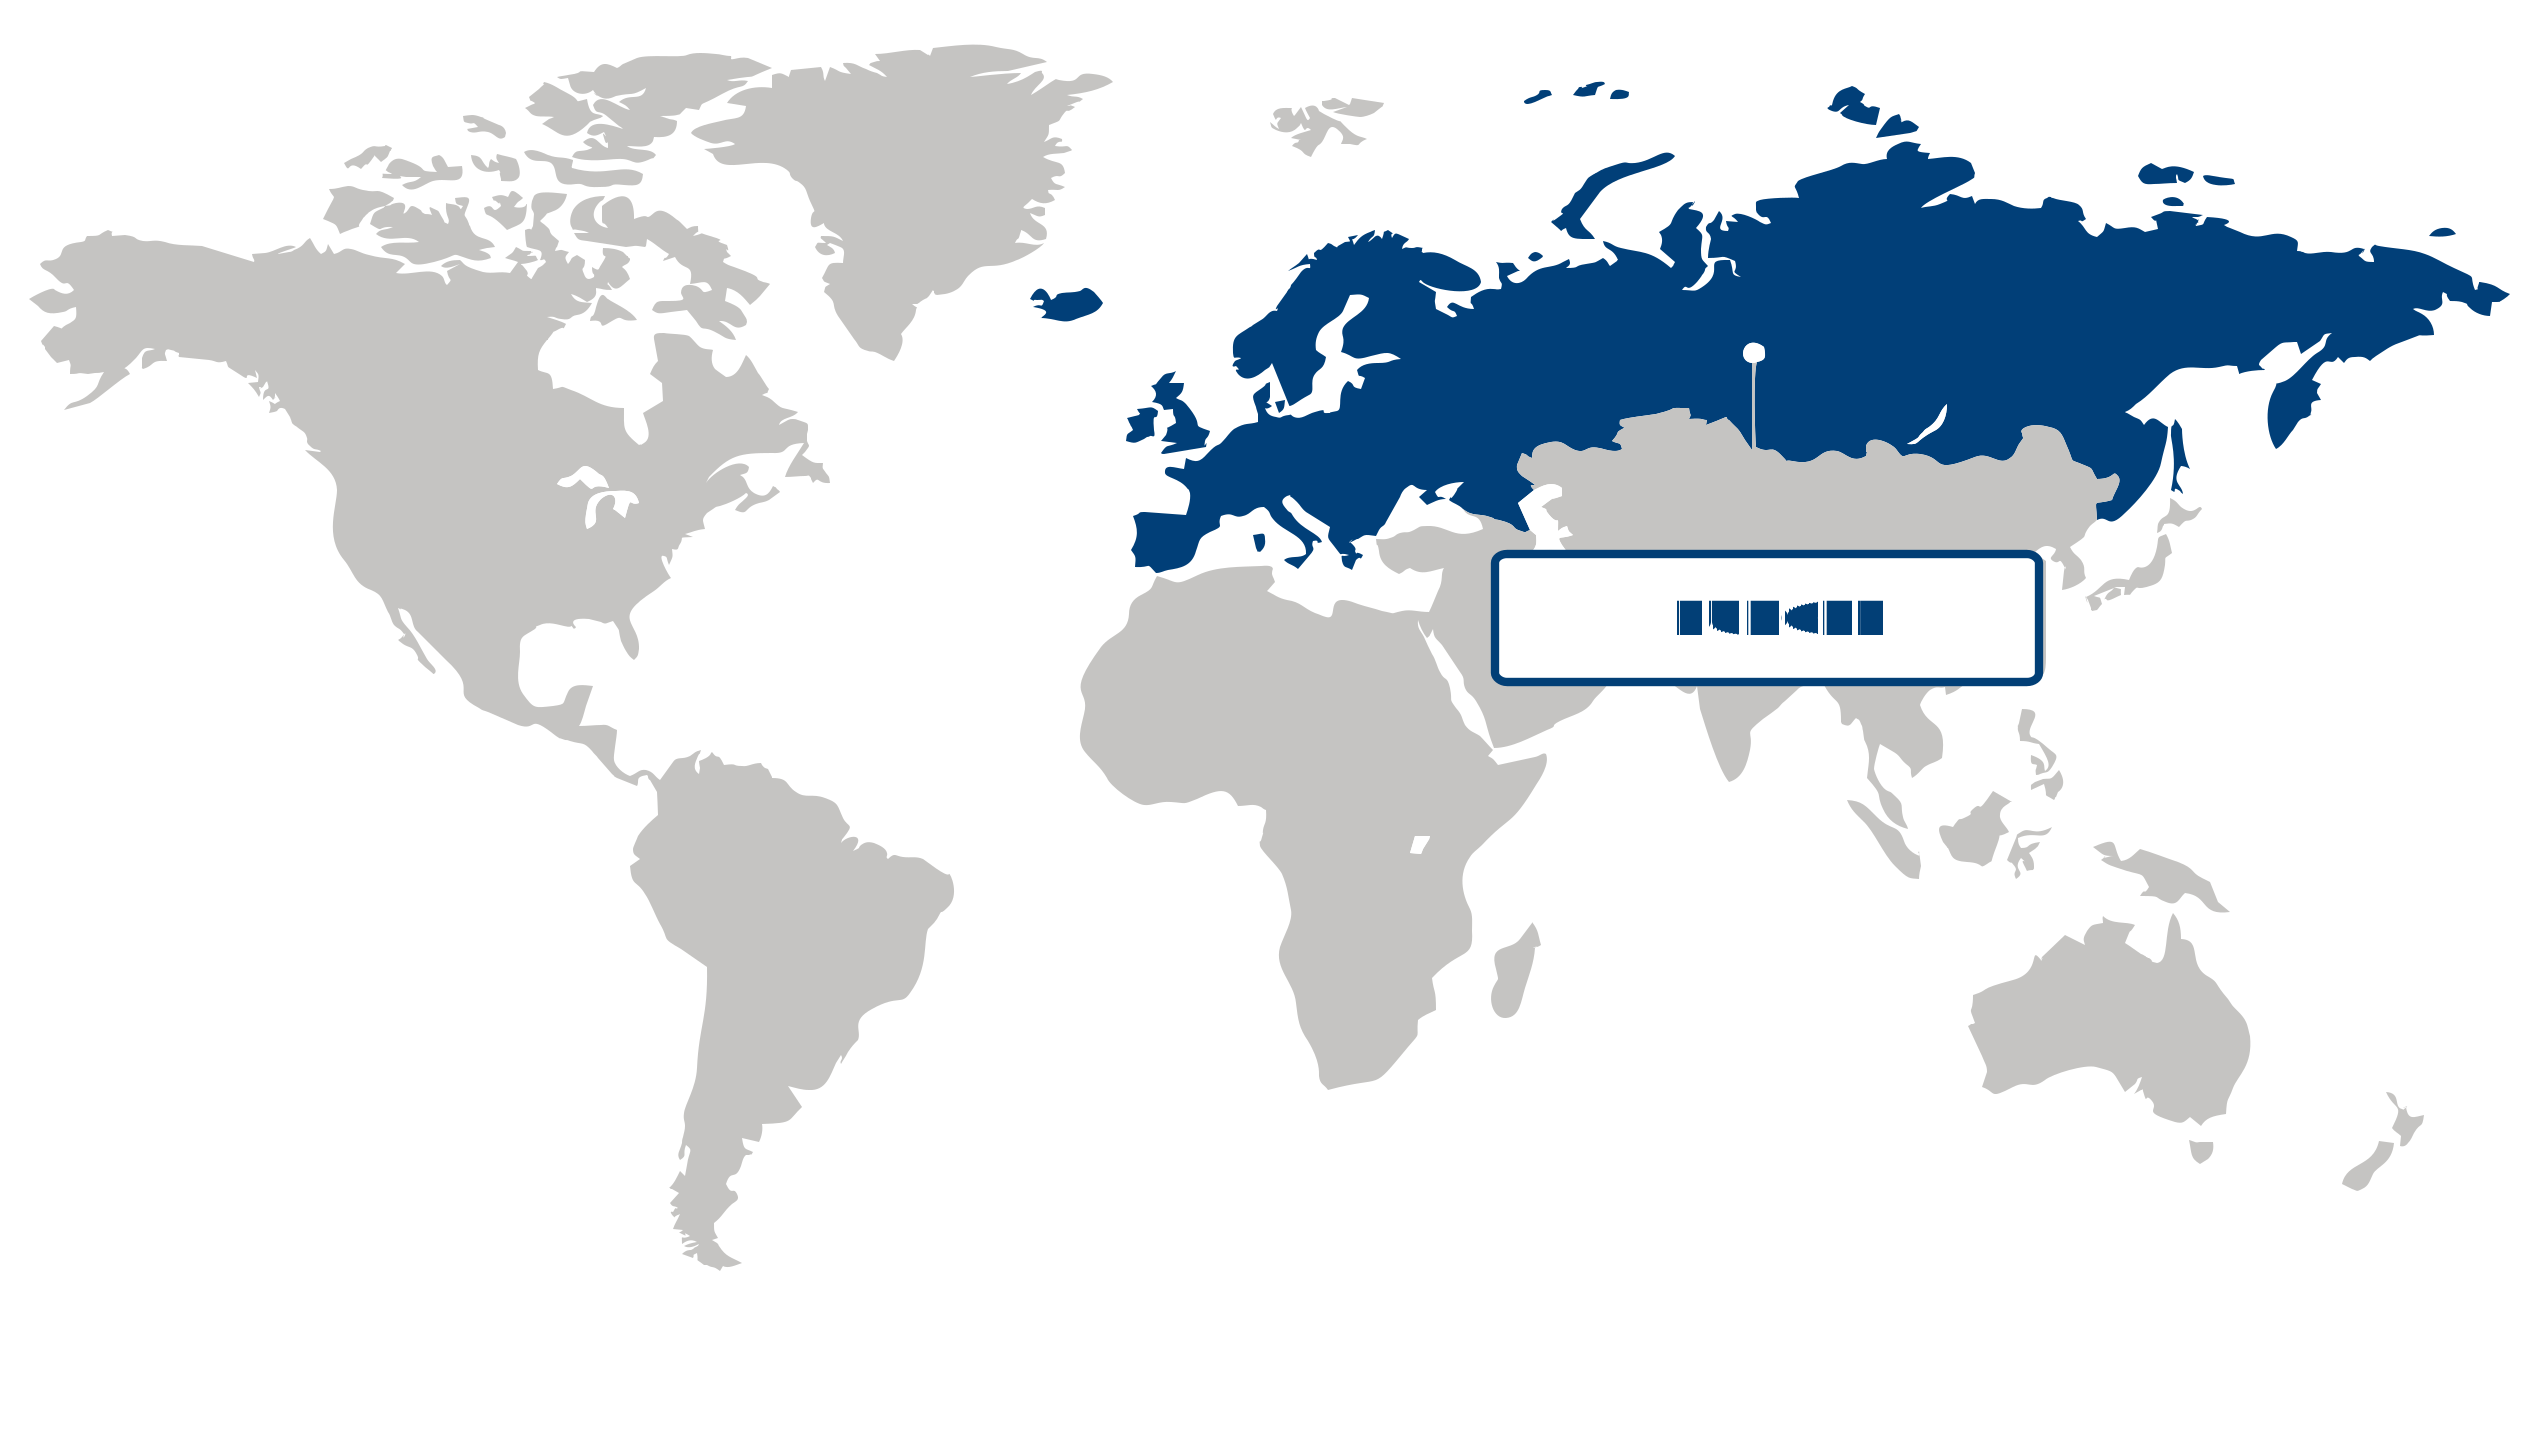
Europe captured over 41% of the global bio-based naphtha market in 2025 and is the largest regional market, driven by strong policy alignment and fast-moving industrial adoption. European Commission initiatives such as the Circular Economy Action Plan and the European Green Deal have created procurement and regulatory incentives that tilt petrochemical demand toward renewable, drop-in feedstocks; trade groups like the European Chemical Industry Council (Cefic) have highlighted member commitments to scale bio-based streams. Companies including Neste and TotalEnergies have announced capacity expansions and renewable hydrocarbon projects that demonstrate commercial viability, while ADEME funding in France and pilot programs across Germany show public–private coordination. These dynamics—combined with integrated refinery infrastructure, established chemical clusters, and growing corporate sustainability targets—position Europe to capture downstream integration and feedstock valorization opportunities over the coming decade.
Germany anchors the Europe bio-based naphtha market as a technology and industrialization leader with a dense chemicals ecosystem that accelerates commercialization. Major players such as BASF have detailed circular-chemistry initiatives and co-processing tests, and the Federal Ministry for Economic Affairs and Climate Action (BMWK) has signaled support for industrial decarbonization projects that include bio-based feedstocks; Fraunhofer institutes provide applied R&D that shortens scale-up timelines. Germany’s advanced manufacturing base and supplier networks favor early adoption by large-volume chemical buyers and specialty converters, strengthening offtake pathways and enabling process optimizations that reduce unit costs—factors that feed directly into wider European supply stability and investor interest.
France is positioned as a pivotal hub in the Europe bio-based naphtha market given its refinery integration and targeted public financing. TotalEnergies’ biorefinery operations (e.g., La Mède) and company press releases on renewable hydrocarbons show refinery-based routes to produce drop-in naphtha, while ADEME and the France 2030 program provide grant and loan support for bio-based chemical projects and feedstock logistics. France’s combination of refinery capacity, policy incentives, and feedstock sourcing from regional agriculture creates commercially viable corridors for supplying renewable naphtha to plastics and chemical manufacturers across Europe, reinforcing regional scale-up and export potential.
North America Market Analysis:
North America emerged as the fastest-growing region in the bio-based naphtha market, posting a CAGR of 17.9%, driven primarily by rising demand for renewable fuels and low‑carbon fuel standards. Regulatory frameworks such as the U.S. Environmental Protection Agency’s Renewable Fuel Standard and the California Air Resources Board’s Low Carbon Fuel Standard are creating durable demand signals that favor renewable hydrocarbon streams; the U.S. Department of Energy has further supported scale-up through Bioenergy Technologies Office grants for advanced conversion technologies. Industry actors including Neste have announced capacity and product expansions for renewable hydrocarbons, while Gulf Coast logistics and existing petrochemical clusters enable rapid offtake and co‑processing. These policy, capital, and infrastructure alignments position North America to capture feedstock-to-market efficiencies and innovation-led cost declines over the next investment cycle, presenting material entry and scaling opportunities for producers and downstream buyers.
The U.S. serves as the primary demand engine for the bio-based naphtha market, where federal and state policy is translating directly into commercial activity and procurement. The U.S. Environmental Protection Agency’s Renewable Fuel Standard creates blending obligations that increase merchant demand for renewable liquid intermediates, while the California Air Resources Board’s LCFS drives premium pricing for low‑carbon feedstocks—both influencing refinery co‑processing strategies and procurement by chemical makers. The U.S. Department of Energy has funded demonstration projects and feedstock logistics studies that reduce commercialization risk, and companies such as Neste have signaled supply partnerships into U.S. markets. For investors and strategists, the U.S. market’s policy-driven demand, concentrated petrochemical hubs, and active technology funding make it the strategic linchpin that reinforces North America’s regional leadership in bio-based naphtha.
Asia Pacific Market Trends:
Asia Pacific held a commanding share of the bio-based naphtha market, driven by large petrochemical demand centers, abundant biomass feedstock corridors, and accelerating policy signals favoring low‑carbon feedstocks. Regional momentum is visible in multilateral and corporate activity— the International Energy Agency (IEA) has highlighted Asia Pacific’s rising role in advanced biofuel adoption, the Asian Development Bank (ADB) has expanded financing for low‑carbon fuel projects, and Neste has strengthened operations and feedstock partnerships in Singapore to serve regional refining and petrochemical hubs. National energy ministries and trade authorities across the region are updating procurement and blending targets, while logistics investments in port infrastructure and refinery co‑processing (reported by port authorities in Singapore and the Port of Yokohama) lower integration barriers. These cumulative dynamics position the region for sizable commercial scale‑up and investor interest over the medium term.
Japan acts as a technology‑led adopter in the bio-based naphtha market, leveraging advanced refining know‑how, supportive industrial policy, and a concentrated base of petrochemical end‑users. Japan’s Ministry of Economy, Trade and Industry (METI) has signaled support for biobased feedstock pathways through its Green Growth Strategy, and companies such as ENEOS and Mitsubishi Chemical have publicly described R&D and pilot activities on biomass co‑processing and renewable feedstock integration. High unit values in Japan’s petrochemical chain and strong OEM and chemical producer demand encourage early commercial trials and premium product placements, making Japan a testing ground for higher‑value bio‑naphtha applications and technology demonstration that can be scaled elsewhere in Asia Pacific.
China functions as a scale‑driven producer in the bio-based naphtha market, where feedstock aggregation, large refining complexes, and state policy underpin rapid capacity build‑out. The National Energy Administration (NEA) and the Ministry of Ecology and Environment have issued guidance supporting non‑fossil energy expansion and industrial decarbonization, and state groups such as Sinopec and CNPC have announced pilot programs and strategic initiatives to develop biomass‑to‑chemical routes and co‑processing capabilities. Domestic feedstock sourcing and integrated petrochemical demand create an efficiency advantage for large‑scale deployment; strategically, China’s scale and vertical integration offer a pathway to cost reductions that can materially improve regional feedstock economics and commercial viability.
| Parameter | North America | Asia Pacific | Europe | Latin America | MEA |
|---|---|---|---|---|---|
| Innovation Hub i Scale Nascent Developing Advanced | |||||
| Cost-Sensitive Region i Scale Low Medium High | |||||
| Regulatory Environment i Scale Restrictive Neutral Supportive | |||||
| Demand Drivers i Scale Weak Moderate Strong | |||||
| Development Stage i Scale Emerging Developing Developed | |||||
| Adoption Rate i Scale Low Medium High | |||||
| New Entrants / Startups i Scale Sparse Moderate Dense | |||||
| Macro Indicators i Scale Weak Stable Strong |
Segment Leadership and Growth Trends
Bio-based Naphtha Market Share (%), by Source, 2026
Go beyond the chart, access full insights & data tables
Request Free Sample ReportVegetable oil dominated the bio-based naphtha market as the largest share in 2025, driven by abundant sustainable sourcing and established processing infrastructure. Leadership reflects large, global supplies of vegetable oils, retrofit-ready refining assets and long-standing merchant and feedstock contracts; FAO reporting on global oilseed production and Neste’s commercial-scale renewable product operations underscore supply reliability and processing scale. The segment benefits from corporate sustainability mandates and traceability programs that ease procurement, while investments by Cargill and ADM into feedstock logistics demonstrate supply-chain maturation. This creates strategic scale advantages for incumbents and niche specialization opportunities for new entrants, and the segment should remain central near-term given ongoing corporate decarbonization commitments and policy frameworks such as the European Commission’s Renewable Energy Directive.
Analysis by Application
Petrochemical represented largest share in the bio-based naphtha market in 2025 as demand shifts toward bio-based feedstocks for plastics production. The petrochemical segment leads because major polymer producers are sourcing lower‑carbon feedstocks—evidenced by Braskem’s bio‑based polyethylene initiatives and guidance from PlasticsEurope and Cefic on feedstock transition—making bio‑naphtha attractive for existing crackers and monomer supply chains. Customer preference for lower‑carbon polymers, regulatory pressure on lifecycle emissions, and partnerships between chemical majors and renewable feedstock suppliers are accelerating adoption. This opens opportunities for integrated chemical firms to secure feedstock advantage and for agile suppliers to provide tailored bio‑naphtha streams, and the segment is likely to retain prominence near to medium term as circularity targets and industry pledges sustain demand.
| Segment | Sub-Segment | Largest Segment | Fastest Growing |
|---|---|---|---|
| Source | Vegetable Oil, Biomass | ||
| Application | Gasoline, Petrochemical, Chemicals, Fertilizers, Construction, Others |
Unlock insights tailored to your business with our bespoke market research solutions.
Click to get your customized report now.
Competitive Landscape and Market Positioning
The competitive environment is characterized by moves to secure and integrate feedstock, accelerate pilot-to-commercial transitions, and broaden technology portfolios through targeted transactions and technology access. Several players have tied up with biomass suppliers and adjusted asset footprints to co‑locate conversion capacity with steam crackers and refineries, while others have advanced demonstration facilities and expanded licensing or technology partnerships to improve conversion yields and product consistency. These actions sharpen differentiation: integrated refiners and national champions favor scale and downstream capture, specialty chemical firms press advantages in catalysis and process optimization, and vertically integrated biomass players drive access to lower‑cost, consistent feed streams—collectively raising barriers for newcomers and shifting competition toward feedstock certainty and demonstrated commercial performance.
Strategic / Actionable Recommendations for Regional Players
North America: Prioritize partnerships with agricultural, forestry and waste processors to secure long‑term, consistent feedstock and explore co‑location with existing crackers or refineries to reduce logistics and capital intensity. Focus pilot efforts on conversion routes with rapid integration into petrochemical value chains and establish commercial offtake agreements with regional commodity and specialty buyers to shorten commercialization timelines.
Asia Pacific: Leverage relationships with large utilities, state refiners and pulp/sugar sectors to aggregate feedstock at scale and accelerate demonstration projects. Emphasize process intensification and local technology adaptation to handle diverse biomass streams, and seek transactional structures with national champions that de‑risk capital deployment while opening distribution channels across fast‑growing industrial corridors.
Europe: Align offerings with circularity, sustainability certification and strict fuel/chemical specifications to win premium demand from brand‑sensitive buyers. Work closely with forestry and biorefinery partners on traceability, invest in cradle‑to‑gate decarbonization measures, and pursue collaborative R&D with public institutions to refine high‑value product grades suited to stringent regulatory and industrial requirements.
| Company | Market Share | Company Revenue | Revenue CAGR (%) | Product Portfolio | Geographic Presence | Innovation / R&D Focus | Strategic Developments |
|---|---|---|---|---|---|---|---|
| No companies available. | |||||||
Customize Your Report
Explore examples of how this report can be tailored to different research needs, including custom segments, additional topics or chapters, and related reports. Click a section of the wheel or its numbered marker to explore the available options.
Bio-based Naphtha Market — Custom Segments
| Segment | Sub-Segment |
|---|---|
| No segment data available. | |
Bio-based Naphtha Market — Custom TOC
| Custom Chapter | Chapter Details | ||
|---|---|---|---|
| No custom TOC data available. | |||
Need a different cut of the data?
Request Custom ResearchHow much revenue does the bio-based naphtha market generate?
What is the projected value of the bio-based naphtha industry by 2035?
In which region is the bio-based naphtha market most concentrated?
What region has posted the highest CAGR in the bio-based naphtha sector?
What share does vegetable oil segment hold in the bio-based naphtha sector as of 2025?
Where is the petrochemical segment seeing the strongest adoption within the bio-based naphtha industry?
What are the prominent companies operating in the bio-based naphtha landscape?
Our Clients
"The report helped us understand emerging consumer trends in our product category. It clarified where to focus innovation for the next product launch."
LyondellBasell
"The regional forecast section was incredibly useful. We were able to identify two new potential partners in Europe thanks to the vendor mapping you included."
SABIC
"We appreciated how actionable the recommendations were. It guided us to improve supply chain resilience."
Olin Corporation
Our Research Team & Methodology
Every Fundamental Business Insights report is built by a dedicated vertical research team, validated through a structured primary-and-secondary methodology, and reviewed for accuracy before it reaches you.
Research Team Overview
Prepared by the Chemicals & Materials Research Team
Delivery
Published
Demand
Available
Support
Trust & Compliance
Research Intelligence
| Source | Reference |
|---|---|
| American Chemistry Council (ACC) | www.americanchemistry.com |
| European Chemical Industry Council (Cefic) | cefic.org |
| International Council of Chemical Associations (ICCA) | icca-chem.org |
| European Chemicals Agency (ECHA) | echa.europa.eu |
| U.S. Environmental Protection Agency (EPA) | www.epa.gov |
| ASTM International | www.astm.org |
| International Organization for Standardization (ISO) | www.iso.org |
| National Institute of Standards and Technology (NIST) | www.nist.gov |
| Plastics Industry Association (PLASTICS) | www.plasticsindustry.org |
| European Biplastics | www.european-bioplastics.org |
| The Adhesive and Sealant Council (ASC) | www.ascouncil.org |
| National Association of Corrosion Engineers (AMPP) | www.ampp.org |
| Society of Plastics Engineers (SPE) | www.4spe.org |
| International Fertilizer Association (IFA) | www.fertilizer.org |
| CropLife International | croplife.org |
| Packaging Europe | packagingeurope.com |
| Flexible Packaging Association (FPA) | www.flexpack.org |
| Battery Council International (BCI) | batterycouncil.org |
| International Copper Association (ICA) | internationalcopper.org |
| World Steel Association | worldsteel.org |
Research Workflow & Quality Assurance
Data Collection
Verified information gathered through primary and secondary research.
Data Triangulation
Cross-validation using multiple independent data sources.
Forecast Modelling
Market estimates developed using historical trends and analytical models.
Analyst Validation
Findings reviewed by domain experts for accuracy and consistency.
Editorial & Quality Review
Final editorial, quality, and compliance checks before publication.
Final Publication
Released after successful completion of the internal review process.
Report Coverage
📊 Market Assessment
- Market Size & Forecast
- Market Segmentation
- Regional Analysis
- Growth Drivers & Challenges
- Market Dynamics
🏢 Competitive Intelligence
- Competitive Landscape
- Company Profiles
- Competitive Benchmarking
- Mergers & Acquisitions
- Market Share Analysis or Key Company Strategies
🔍 Strategic Analysis
- Value Chain Analysis
- Porter's Five Forces
- PESTLE Analysis
- Pricing Trends
- Supply-Demand Analysis
🚀 Future Outlook
- Technology Landscape
- Regulatory Landscape
- Investment & Funding Landscape
- Emerging Opportunities
- Future Market Outlook
Have a question about this report or need a custom scope?
Request Customization