Tensiometer Market Size & Growth Forecast 2027–2036, By Segments (Product, End-use), Regional Demand Trends (North America, Asia Pacific, Europe), Key Country Insights (U.S., Japan, South Korea, Germany, France, Italy), and Competitive Landscape
Market Size and Growth Outlook
Tensiometer Market size was estimated at USD 152.2 million in 2026 and is projected to grow at a 5.13% CAGR from 2027 to 2036, attaining USD 251 million by 2036. The industry revenue for 2027 is assessed at USD 158.78 million.
Get more details on this report
Request Free Sample ReportTensiometer Market Intelligence Snapshot
Regional Market Dynamics
- Asia Pacific led the market in 2026, supported by its strong manufacturing base, expanding industrial activity, and widespread use of tensiometers for quality control and formulation testing.
- North America is projected to grow at an 8.59% CAGR, driven by greater adoption of precision analytical instruments for research, product development, and regulated industrial applications.
Segment Momentum
- Force Tensiometer leads with a 31.1% share in 2026 due to its broad use in routine surface and interfacial testing, offering reliable, repeatable performance in standard lab and industrial workflows.
- It is growing fastest due to rising demand for precise formulation control and sensitive liquid behavior analysis, where reproducible measurements are critical in specialized development and production environments.
Market Expansion Drivers
- Increasing demand for precision surface measurement tools supporting advanced formulation quality control.
- Rising laboratory automation and digital integration accelerating adoption of advanced tensiometer systems.
- Expanding pharmaceutical and specialty chemical R&D investments increasing demand for analytical instrumentation.
Leading Market Participants
- Major players in the tensiometer market include Biolin Scientific AB (Sweden), KRÜSS Scientific GmbH (Germany), DataPhysics Instruments GmbH (Germany), Kyowa Interface Science Co., Ltd. (Japan), SITA Messtechnik GmbH (Germany), First Ten Angstroms, Inc. (United States), ramé-hart instrument co. (United States), Kibron Inc. (Finland), LAUDA Scientific GmbH (Germany), TECLIS Scientific (France).
Global Market Forecast Snapshot
Market Outlook
- 2026 Market Size: USD 152.2 million
- 2027 Estimated Market Size: USD 158.78 million.
- Projected Market Size: USD 251 million by 2036
- Growth Forecast: 5.13% CAGR (2027-2036)
Regional and Segment Outlook
- Leading Regional Market: Asia Pacific
- High-Growth Regional Hub: North America
- Core Revenue Segment: Force Tensiometer (Product) | Chemical (End-use)
- Emerging Opportunity Segment: Bubble Pressure Tensiometer (Product) | Pharmaceutical & Biopharmaceutical (End-use)
Market Growth Drivers and Industry Trends
Increasing demand for precision surface measurement tools supporting advanced formulation quality control
The tensiometer market is being supported by growing requirements for accurate surface and interfacial property measurement across formulation and quality-control processes. Precise evaluation of surface tension and related characteristics is important when developing products where wetting, spreading, adhesion, emulsification, or coating behavior influences performance. Industries using complex formulations therefore rely on analytical instruments to maintain consistency between batches, investigate material interactions, and optimize production parameters, creating greater demand for reliable surface measurement capabilities in laboratory and industrial quality-control environments.
Rising laboratory automation and digital integration accelerating adoption of advanced tensiometer systems
Laboratory automation will propel the tensiometer market growth as research and quality-control environments increasingly integrate analytical instruments with automated workflows and digital data-management systems. Automated sample handling, programmable measurement procedures, and software-based analysis can reduce manual intervention while improving measurement consistency and laboratory productivity. Digital connectivity also allows test results to be captured and integrated into broader laboratory workflows, supporting faster comparison of formulations and more efficient monitoring of surface-property characteristics during research and quality-control activities.
Expanding pharmaceutical and specialty chemical R&D investments increasing demand for analytical instrumentation
Expansion of pharmaceutical and specialty chemical research activities will drive the tensiometer market by increasing the need for analytical tools capable of characterizing materials and formulations during product development. Surface and interfacial properties can influence the behavior of pharmaceutical formulations, coatings, solvents, dispersions, and specialty chemical systems, making precise measurement valuable during experimentation and optimization. As research teams evaluate increasingly complex materials and formulations, analytical instrumentation supports controlled testing, formulation refinement, and reproducible characterization across laboratory development processes.
| Growth Driver | Impact on CAGR | Regulatory Influence | Geographic Relevance | Adoption Rate | Impact Timeline |
|---|---|---|---|---|---|
| Increasing demand for precision surface measurement tools supporting advanced formulation quality control | 1.90% | Moderate | North America, Europe | High | Near Term |
| Rising laboratory automation and digital integration accelerating adoption of advanced tensiometer systems | 1.80% | Moderate | Asia Pacific, North America | Medium | Mid Term |
| Expanding pharmaceutical and specialty chemical R&D investments increasing demand for analytical instrumentation | 1.50% | High | Europe, Asia Pacific | Emerging | Mid Term |
Unlock insights tailored to your business with our bespoke market research solutions.
Click to get your customized report now.
Regional Demand Dynamics
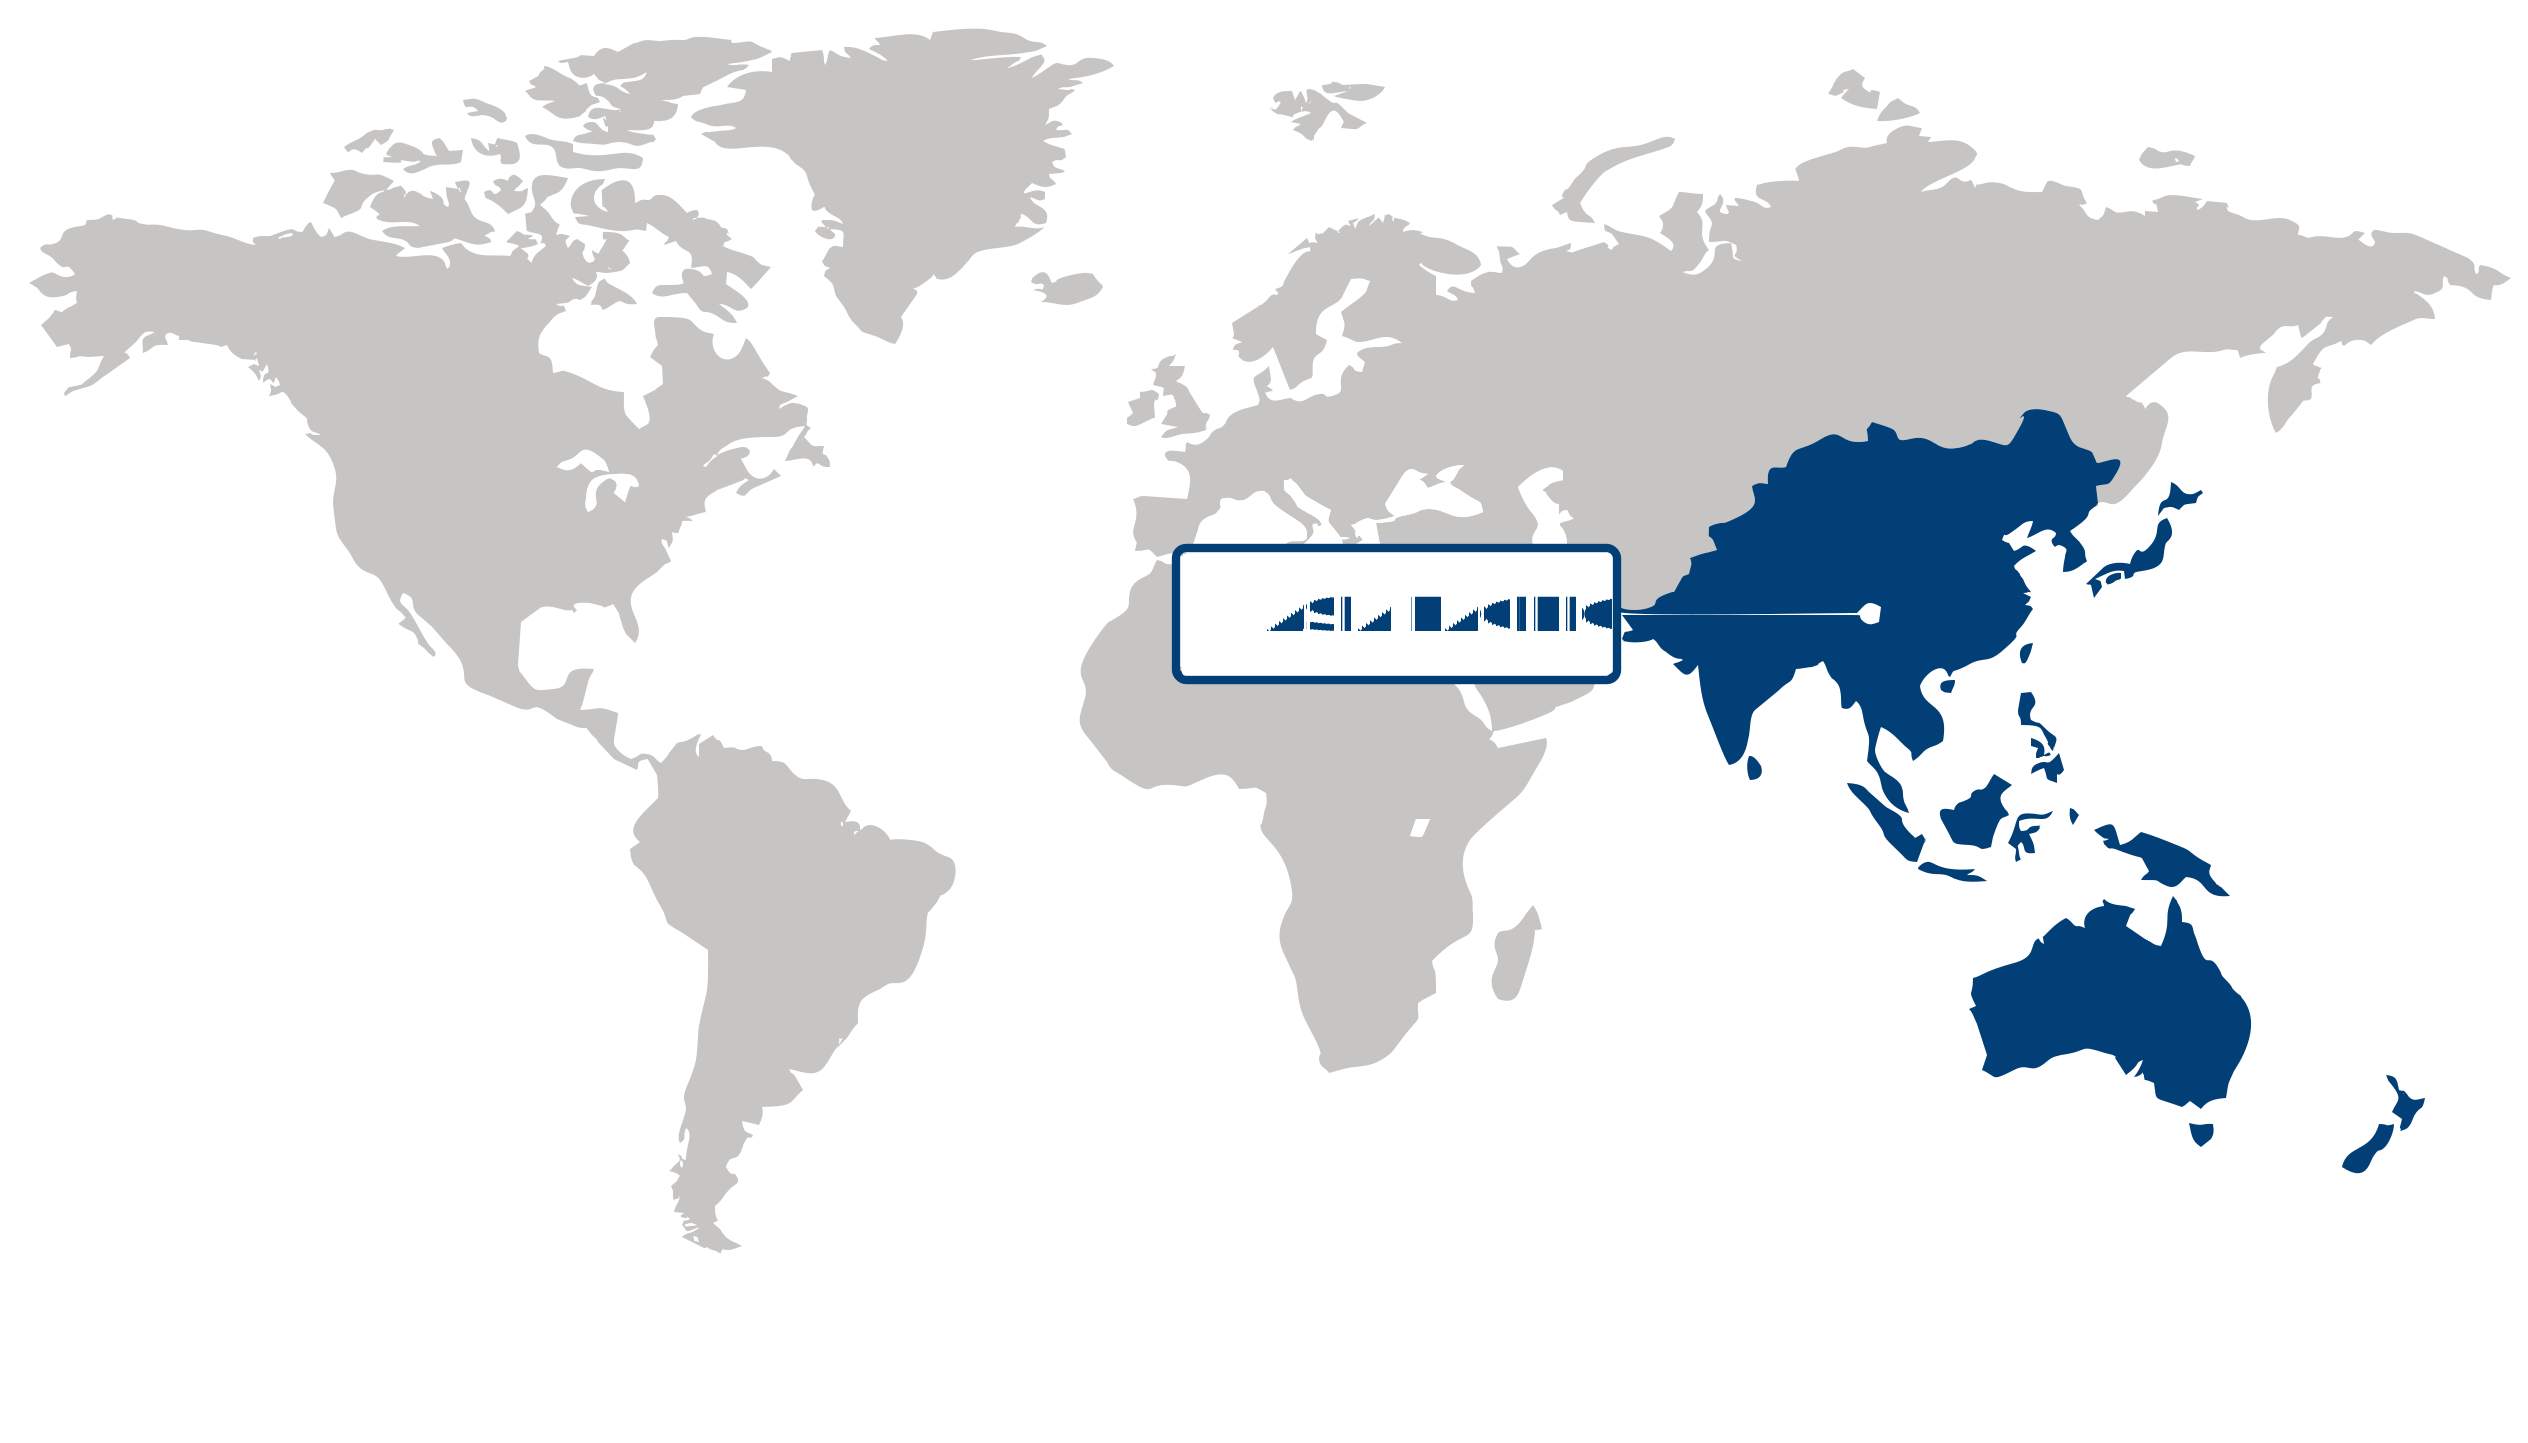
Asia Pacific (Largest Region)
Asia Pacific accounted for the largest share in the tensiometer market in 2026, supported by expanding agricultural activity, increasing emphasis on efficient irrigation, and growing adoption of precision farming practices. Tensiometers are increasingly relevant for monitoring soil moisture and optimizing water application, particularly as agricultural producers seek to improve resource efficiency and crop productivity. Investments in modern farming infrastructure, irrigation systems, and agricultural technologies are creating a favorable environment for demand across the region.
North America (Fastest-Growing Region)
North America represents the fastest-growing region, driven by the increasing integration of precision agriculture, smart irrigation, and data-based farm management practices. Farmers and agricultural operators are placing greater emphasis on optimizing water use and improving soil-condition monitoring, supporting the adoption of reliable soil moisture measurement technologies. Continued modernization of agricultural operations and greater use of technology-enabled irrigation solutions are expected to strengthen demand for tensiometers across the region.
| Parameter | North America | Asia Pacific | Europe | Latin America | MEA |
|---|---|---|---|---|---|
| Innovation Hub i Scale Nascent Developing Advanced | |||||
| Cost-Sensitive Region i Scale Low Medium High | |||||
| Regulatory Environment i Scale Restrictive Neutral Supportive | |||||
| Demand Drivers i Scale Weak Moderate Strong | |||||
| Development Stage i Scale Emerging Developing Developed | |||||
| Adoption Rate i Scale Low Medium High | |||||
| New Entrants / Startups i Scale Sparse Moderate Dense | |||||
| Macro Indicators i Scale Weak Stable Strong |
Key Country Insights
Germany 🇩🇪
Industrial Testing ExcellenceGermany prioritizes high-precision tensiometers that support manufacturing quality assurance and materials research. German laboratories increasingly adopt advanced measurement systems to improve consistency across chemical, automotive, and engineering applications.
France 🇫🇷
Materials Analysis FocusFrance promotes tensiometers for scientific research and industrial material evaluation where accurate surface property measurement is essential. French laboratories continue modernizing testing capabilities to support innovation in specialty chemicals and life sciences.
Italy 🇮🇹
Applied Quality ControlItaly adopts tensiometers across manufacturing industries requiring dependable testing of liquids, coatings, and specialty materials. Italian companies emphasize measurement accuracy and operational efficiency to support product consistency and regulatory compliance.
Japan 🇯🇵
Advanced Laboratory SolutionsJapan applies tensiometers across research institutions and precision manufacturing environments requiring reliable surface characterization. Japanese users value automated measurement capabilities that improve analytical efficiency and reproducibility in laboratory workflows.
South Korea 🇰🇷
Research Infrastructure SupportSouth Korea strengthens demand for tensiometers through expanding research activities in electronics, chemicals, and advanced materials. Laboratories in South Korea increasingly seek digital measurement systems that integrate with modern analytical workflows.
United States 🇺🇸
Precision Measurement DemandThe U.S. market emphasizes tensiometers for laboratory research, industrial quality control, and advanced material testing. Organizations in the U.S. continue investing in accurate surface tension measurement to support product development across chemicals, pharmaceuticals, and coatings.
Segment Leadership and Growth Trends
Tensiometer Market Share (%), by Product, 2026
Go beyond the chart, access full insights & data tables
Request Free Sample ReportProduct Segment Analysis: Force Tensiometer (Largest Segment) vs Bubble Pressure Tensiometer (Fastest-Growing Segment)
The force tensiometer segment led the tensiometer market with a 31.1% share in 2026, supported by its broad applicability in measuring surface and interfacial tension across laboratory and industrial environments. Its established role in characterizing liquids, evaluating formulation behavior, and supporting quality control makes it valuable across applications where accurate and repeatable measurements are essential. The versatility of force-based measurement and its suitability for research, product development, and process monitoring continue to reinforce adoption.
Bubble pressure tensiometers are gaining traction more rapidly as industries increasingly require efficient measurement of dynamic surface tension, particularly in formulations and processes where rapid changes in liquid behavior need to be assessed. Their ability to evaluate surface-active properties under dynamic conditions supports applications involving surfactants, coatings, detergents, and other specialized formulations. Growing emphasis on formulation optimization and process consistency is creating additional demand for this measurement approach.
End-use Segment Analysis: Chemical (Largest Segment) vs Pharmaceutical & Biopharmaceutical (Fastest-Growing Segment)
The chemical segment accounted for the largest share of the tensiometer market, representing 27.11% in 2026. Tensiometers are widely relevant to chemical applications because surface and interfacial tension influence formulation performance, mixing behavior, coating characteristics, and material interactions. Increasing attention to product quality and process control encourages chemical manufacturers to use precise analytical instruments for characterizing liquid properties and maintaining consistency across production activities.
Pharmaceutical & biopharmaceutical applications are expanding at a faster pace as manufacturers place greater emphasis on formulation stability, quality assurance, and controlled material characteristics. Surface tension measurements can support the development and evaluation of specialized formulations, including liquid-based pharmaceutical products and biologically oriented preparations. The growing complexity of formulation development and increased focus on analytical precision are strengthening the need for advanced tensiometry in these industries.
| Segment | Sub-Segment | Largest Segment | Fastest Growing |
|---|---|---|---|
| Product | Optical Tensiometer, Force Tensiometer, Volumetric Tensiometer, Bubble Pressure Tensiometer, Accessories | Force Tensiometer | Bubble Pressure Tensiometer |
| End-use | Chemical, Oil & Gas, Energy, Pharmaceutical & Biopharmaceutical, Medical Device, Cosmetic, Others | Chemical | Pharmaceutical & Biopharmaceutical |
Competitive Landscape and Market Positioning
Prominent players in the tensiometer market:
1. Biolin Scientific AB (Sweden)
2. KRÃœSS Scientific GmbH (Germany)
3. DataPhysics Instruments GmbH (Germany)
4. Kyowa Interface Science Co. Ltd. (Japan)
5. SITA Messtechnik GmbH (Germany)
6. First Ten Angstroms Inc. (United States)
7. ramé-hart instrument co. (United States)
8. Kibron Inc. (Finland)
9. LAUDA Scientific GmbH (Germany)
10. TECLIS Scientific (France)
The tensiometer market is evolving with growing demand for precise measurement tools across scientific and industrial applications. In the tensiometer market, technological improvements are enhancing measurement accuracy and operational reliability. New instrument designs are being introduced to support broader application versatility. Continuous research is strengthening calibration precision and performance consistency.
| Company | Market Share | Company Revenue | Revenue CAGR (%) | Product Portfolio | Geographic Presence | Innovation / R&D Focus | Strategic Developments |
|---|---|---|---|---|---|---|---|
| Biolin Scientific AB (Sweden) | |||||||
| KRÜSS Scientific GmbH (Germany) | |||||||
| DataPhysics Instruments GmbH (Germany) | |||||||
| Kyowa Interface Science Co. Ltd. (Japan) | |||||||
| SITA Messtechnik GmbH (Germany) | |||||||
| First Ten Angstroms Inc. (United States) | |||||||
| ramé-hart instrument co. (United States) | |||||||
| Kibron Inc. (Finland) | |||||||
| LAUDA Scientific GmbH (Germany) | |||||||
| TECLIS Scientific (France). |
Industry Development/News
| Company Name | Date | Key Development |
|---|---|---|
| Biolin Scientific AB | Feb-25 | Biolin Scientific launched the Attension Theta Wafer module, a specialized optical tensiometer configuration designed for high-precision contact angle measurement on semiconductor silicon wafers. The system enables automated wafer mapping and high-throughput surface analysis, enhancing industrial-scale measurement capabilities for semiconductor and advanced materials applications. |
| Kyowa Interface Science Co., Ltd | 2025 | Kyowa Interface Science introduced next-generation automated force tensiometers featuring high-speed optical imaging capabilities. The development enhances measurement accuracy and throughput in surface and interface analysis, supporting advanced material characterization and industrial quality control applications. |
| DataPhysics Instruments GmbH | Apr-24 | DataPhysics Instruments partnered with droptical to commercialize the FlexDrop system for ultra-low-volume droplet dosing in contact angle measurement workflows. The integration enhances precision surface energy analysis capabilities and expands applications in micro-scale surface science and advanced materials characterization. |
| Brighton Science | 2024 | Brighton Science expanded its cloud-connected surface analysis platforms to support industrial quality control workflows. The development strengthens digitalization in surface and interface measurement processes, enabling remote data access, standardized analysis, and improved scalability in industrial testing environments. |
| Biolin Scientific AB | 2024 | Biolin Scientific launched compact benchtop tensiometers optimized for pharmaceutical formulation testing applications. The systems enhance laboratory-scale surface tension and interface measurement capabilities, supporting formulation development workflows in pharmaceutical and life sciences research environments. |
Customize Your Report
Explore examples of how this report can be tailored to different research needs, including custom segments, additional topics or chapters, and related reports. Click a section of the wheel or its numbered marker to explore the available options.
Tensiometer Market — Custom Segments
| Segment | Sub-Segment |
|---|---|
| Automation Level | Manual, Semi-Automated, Fully Automated |
| Buyer Type | Research and Academic Institutions, Industrial Laboratories, Quality Control and Testing Organizations, Contract Testing Organizations |
| Deployment Setting | Laboratory-Based, At-Line, In-Line and Process-Integrated |
Tensiometer Market — Custom TOC
| Custom Chapter | Custom Details |
|---|---|
| Precision Measurement Application Mapping |
|
| Sensor Technology Evolution |
|
| Laboratory and Industrial Adoption Trends |
|
Need a different cut of the data?
Request Custom ResearchWhat is the current revenue of the tensiometer market?
How much is the tensiometer industry expected to grow by 2036?
How is rising demand for precision surface measurement reshaping quality control requirements in the tensiometer market?
How are automation and digital integration influencing instrument adoption in the tensiometer market?
Why does the Force Tensiometer lead the product segment in the tensiometer market?
Why is Pharmaceutical & Biopharmaceutical the fastest-growing end-use segment?
Why is Asia Pacific the leading region in the tensiometer market?
What is driving tensiometer market growth in North America?
Which companies are driving growth in the tensiometer landscape?
Our Clients
"The team at Fundamental Business Insights & Consulting demonstrated a commitment to excellence, not only in the quality of the report but also in their client-centric approach."
FANUC
"The level of detail in the market segmentation provided were particularly noteworthy. The detailed country-level insights were also very helpful."
B&R Industrial Automation GmbH
"The consultant took the time to understand our specific business objectives, ensuring that the reports were tailored to address our unique challenges and opportunities."
KUKA SE & Co. KGaA
Our Research Team & Methodology
Every Fundamental Business Insights report is built by a dedicated vertical research team, validated through a structured primary-and-secondary methodology, and reviewed for accuracy before it reaches you.
Research Team Overview
Prepared by the Industrial Automation & Equipment Research Team
Delivery
Published
Demand
Available
Support
Trust & Compliance
Research Domains
10 coverage areasResearch Intelligence
| Source | Reference |
|---|---|
| International Society of Automation (ISA) | www.isa.org |
| International Organization for Standardization (ISO) | www.iso.org |
| National Institute of Standards and Technology (NIST) | www.nist.gov |
| IEEE | www.ieee.org |
| VDMA (German Mechanical Engineering Industry Association) | www.vdma.org |
| Association for Advancing Automation (A3) | www.automate.org |
| International Federation of Robotics (IFR) | ifr.org |
| ASME (American Society of Mechanical Engineers) | www.asme.org |
| ASHRAE | www.ashrae.org |
| American Society of Heating, Refrigerating and Air-Conditioning Engineers (ASHRAE) | www.ashrae.org |
| Material Handling Industry (MHI) | www.mhi.org |
| OSHA (Occupational Safety and Health Administration) | www.osha.gov |
| National Fire Protection Association (NFPA) | www.nfpa.org |
| ASTM International | www.astm.org |
| International Electrotechnical Commission (IEC) | www.iec.ch |
| Open Process Automation Forum (The Open Group) | www.opengroup.org/open-process-automation-forum |
| AGMA (American Gear Manufacturers Association) | www.agma.org |
| Association of Equipment Manufacturers (AEM) | www.aem.org |
| Food and Agriculture Organization (FAO) | www.fao.org |
| International Labour Organization (ILO) | www.ilo.org |
Research Workflow & Quality Assurance
Data Collection
Verified information gathered through primary and secondary research.
Data Triangulation
Cross-validation using multiple independent data sources.
Forecast Modelling
Market estimates developed using historical trends and analytical models.
Analyst Validation
Findings reviewed by domain experts for accuracy and consistency.
Editorial & Quality Review
Final editorial, quality, and compliance checks before publication.
Final Publication
Released after successful completion of the internal review process.
Report Coverage
📊 Market Assessment
- Market Size & Forecast
- Market Segmentation
- Regional Analysis
- Growth Drivers & Challenges
- Market Dynamics
🏢 Competitive Intelligence
- Competitive Landscape
- Company Profiles
- Competitive Benchmarking
- Mergers & Acquisitions
- Market Share Analysis or Key Company Strategies
🔍 Strategic Analysis
- Value Chain Analysis
- Porter's Five Forces
- PESTLE Analysis
- Pricing Trends
- Supply-Demand Analysis
🚀 Future Outlook
- Technology Landscape
- Regulatory Landscape
- Investment & Funding Landscape
- Emerging Opportunities
- Future Market Outlook
Have a question about this report or need a custom scope?
Request Customization