Quantum Dots (QD) Market Size & Forecasts 2026-2035, By Segments (Type, Application), Growth Opportunities, Innovation Landscape, Regulatory Shifts, Strategic Regional Insights (U.S., Japan, China, South Korea, UK, Germany, France), and Competitive Dynamics (Quantum Solutions, NanoTech Labs, Luminescence Corp, BrightDot Inc, CrystalQ)
Market Size and Growth Outlook
Quantum Dots Market size is set to grow from USD 13.36 billion in 2025 to USD 73.56 billion by 2035, reflecting a CAGR greater than 18.6% through 2026-2035. Industry revenues in 2026 are estimated at USD 15.58 billion.
Get more details on this report
Request Free Sample ReportQuantum Dots (QD) Market Intelligence Snapshot
Regional Market Dynamics
Segment Momentum
Market Expansion Drivers
Leading Market Participants
Global Market Forecast Snapshot
Market Outlook
Regional and Segment Outlook
Market Growth Drivers and Industry Trends
Consumer demand for richer color, higher dynamic range, and thinner form factors has pushed OEMs to embed quantum-dot technologies into mainstream products: Samsung Electronics markets QLED TVs and Samsung Display has commercialized QD‑OLED panels, while Nanosys supplies quantum dot enhancement films to multiple panel makers. Device-driven procurement and bundled supply agreements are reshaping supplier relationships and channel strategies, favoring vertically integrated players. Established manufacturers can scale margin capture through system integration and licensing; new entrants can pursue specialist OEM partnerships or value-added modules. Recent product launches by Samsung Electronics and supplier announcements from Nanosys underscore durable device-led adoption in the quantum dots (QD) market.
Technological Improvements in QD Materials and Efficiency
Improvements in cadmium-free chemistries and higher photoluminescence efficiency are reducing environmental constraints and improving display energy performance: Nanoco and Nanosys have highlighted cadmium-free offerings, and Samsung Display has demonstrated efficiency gains with QD‑OLED prototypes. These technical advances shift competitive dynamics toward IP-rich material suppliers and process innovators, lowering barriers for application expansion into mobile and professional segments. Incumbents can protect positions via R&D investment and manufacturing scale; startups can capture niche value by commercializing novel syntheses or scalable deposition methods. Continued R&D disclosures and patent filings from Nanoco, Nanosys, and Samsung Display signal ongoing maturation of the quantum dots (QD) market.
Global Standardization and Regulatory Compliance for QD Displays
Regulatory frameworks and standards activity are steering material selection and certification processes: REACH implementation by the European Chemicals Agency (ECHA) and oversight from the U.S. Environmental Protection Agency (EPA), together with standards work by VESA and the International Electrotechnical Commission (IEC), are prompting manufacturers to prioritize compliant, traceable QD supply chains. Nanoco’s public positioning on cadmium-free compliance and panel makers’ certification efforts demonstrate how policy drives procurement and product roadmaps. Compliance capabilities become a competitive moat for established suppliers, while newcomers can differentiate through third‑party testing and transparent traceability services. Ongoing reviews at ECHA and standards development at VESA and IEC point to clearer compliance benchmarks ahead for the quantum dots (QD) market.
Industry Restraints:
Toxicity and Environmental Regulation (Cadmium Restrictions)
Regulatory constraints around cadmium significantly slow QD commercialization by forcing material substitution, complex compliance workflows, and variant product lines for different jurisdictions. The European Chemicals Agency (ECHA) and the European Commission’s RoHS Directive explicitly limit cadmium use in electronics, while the U.S. Environmental Protection Agency (EPA) maintains strict hazardous substance controls—pressures that have pushed suppliers such as Nanosys to prioritize cadmium‑free indium‑phosphide QDs in public communications. For incumbents, compliance raises retrofitting and certification costs; for entrants, demonstrating safe, approved chemistries lengthens time‑to‑market and capital needs. Expect continued segmentation between cadmium and cadmium‑free offerings in the near term, with regulatory scrutiny sustaining higher compliance and substitution costs until non‑toxic alternatives reach equivalent performance and supply scale.
Critical Raw-Material Concentration and Supply Risk (Indium and Precursor Scarcity)
The QD value chain is constrained by concentration and scarcity in key precursors—indium, InP precursors, and specialty ligands—exposing producers to price volatility, lead‑time spikes, and single‑source risks documented in U.S. Geological Survey (USGS) mineral summaries. Large display OEMs such as Samsung Display and material innovators like Nanosys rely on a narrow supplier base, amplifying bargaining asymmetries and inventory burdens. Established players can absorb upstream disruptions via long‑term contracts and vertical partnerships; smaller entrants face higher procurement costs and scale barriers. Over the medium term, supply‑side investments, supplier consolidation, and strategic stockpiling will shape competitive advantage, keeping raw‑material security a gating factor for commercial expansion.
| Growth Driver | Impact on CAGR | Regulatory Influence | Geographic Relevance | Adoption Rate | Impact Timeline |
|---|---|---|---|---|---|
| Adoption in display devices for TVs, smartphones, and monitors | 5.00% | Short term (≤ 2 yrs) | Asia Pacific, North America | Low | Fast |
| Technological improvements in QD materials and efficiency | 4.00% | Medium term (2–5 yrs) | Europe, Asia Pacific | Medium | Moderate |
| Global standardization and regulatory compliance for QD displays | 2.00% | Long term (5+ yrs) | North America, Europe | High | Slow |
Unlock insights tailored to your business with our bespoke market research solutions.
Click to get your customized report now.
Regional Demand Dynamics
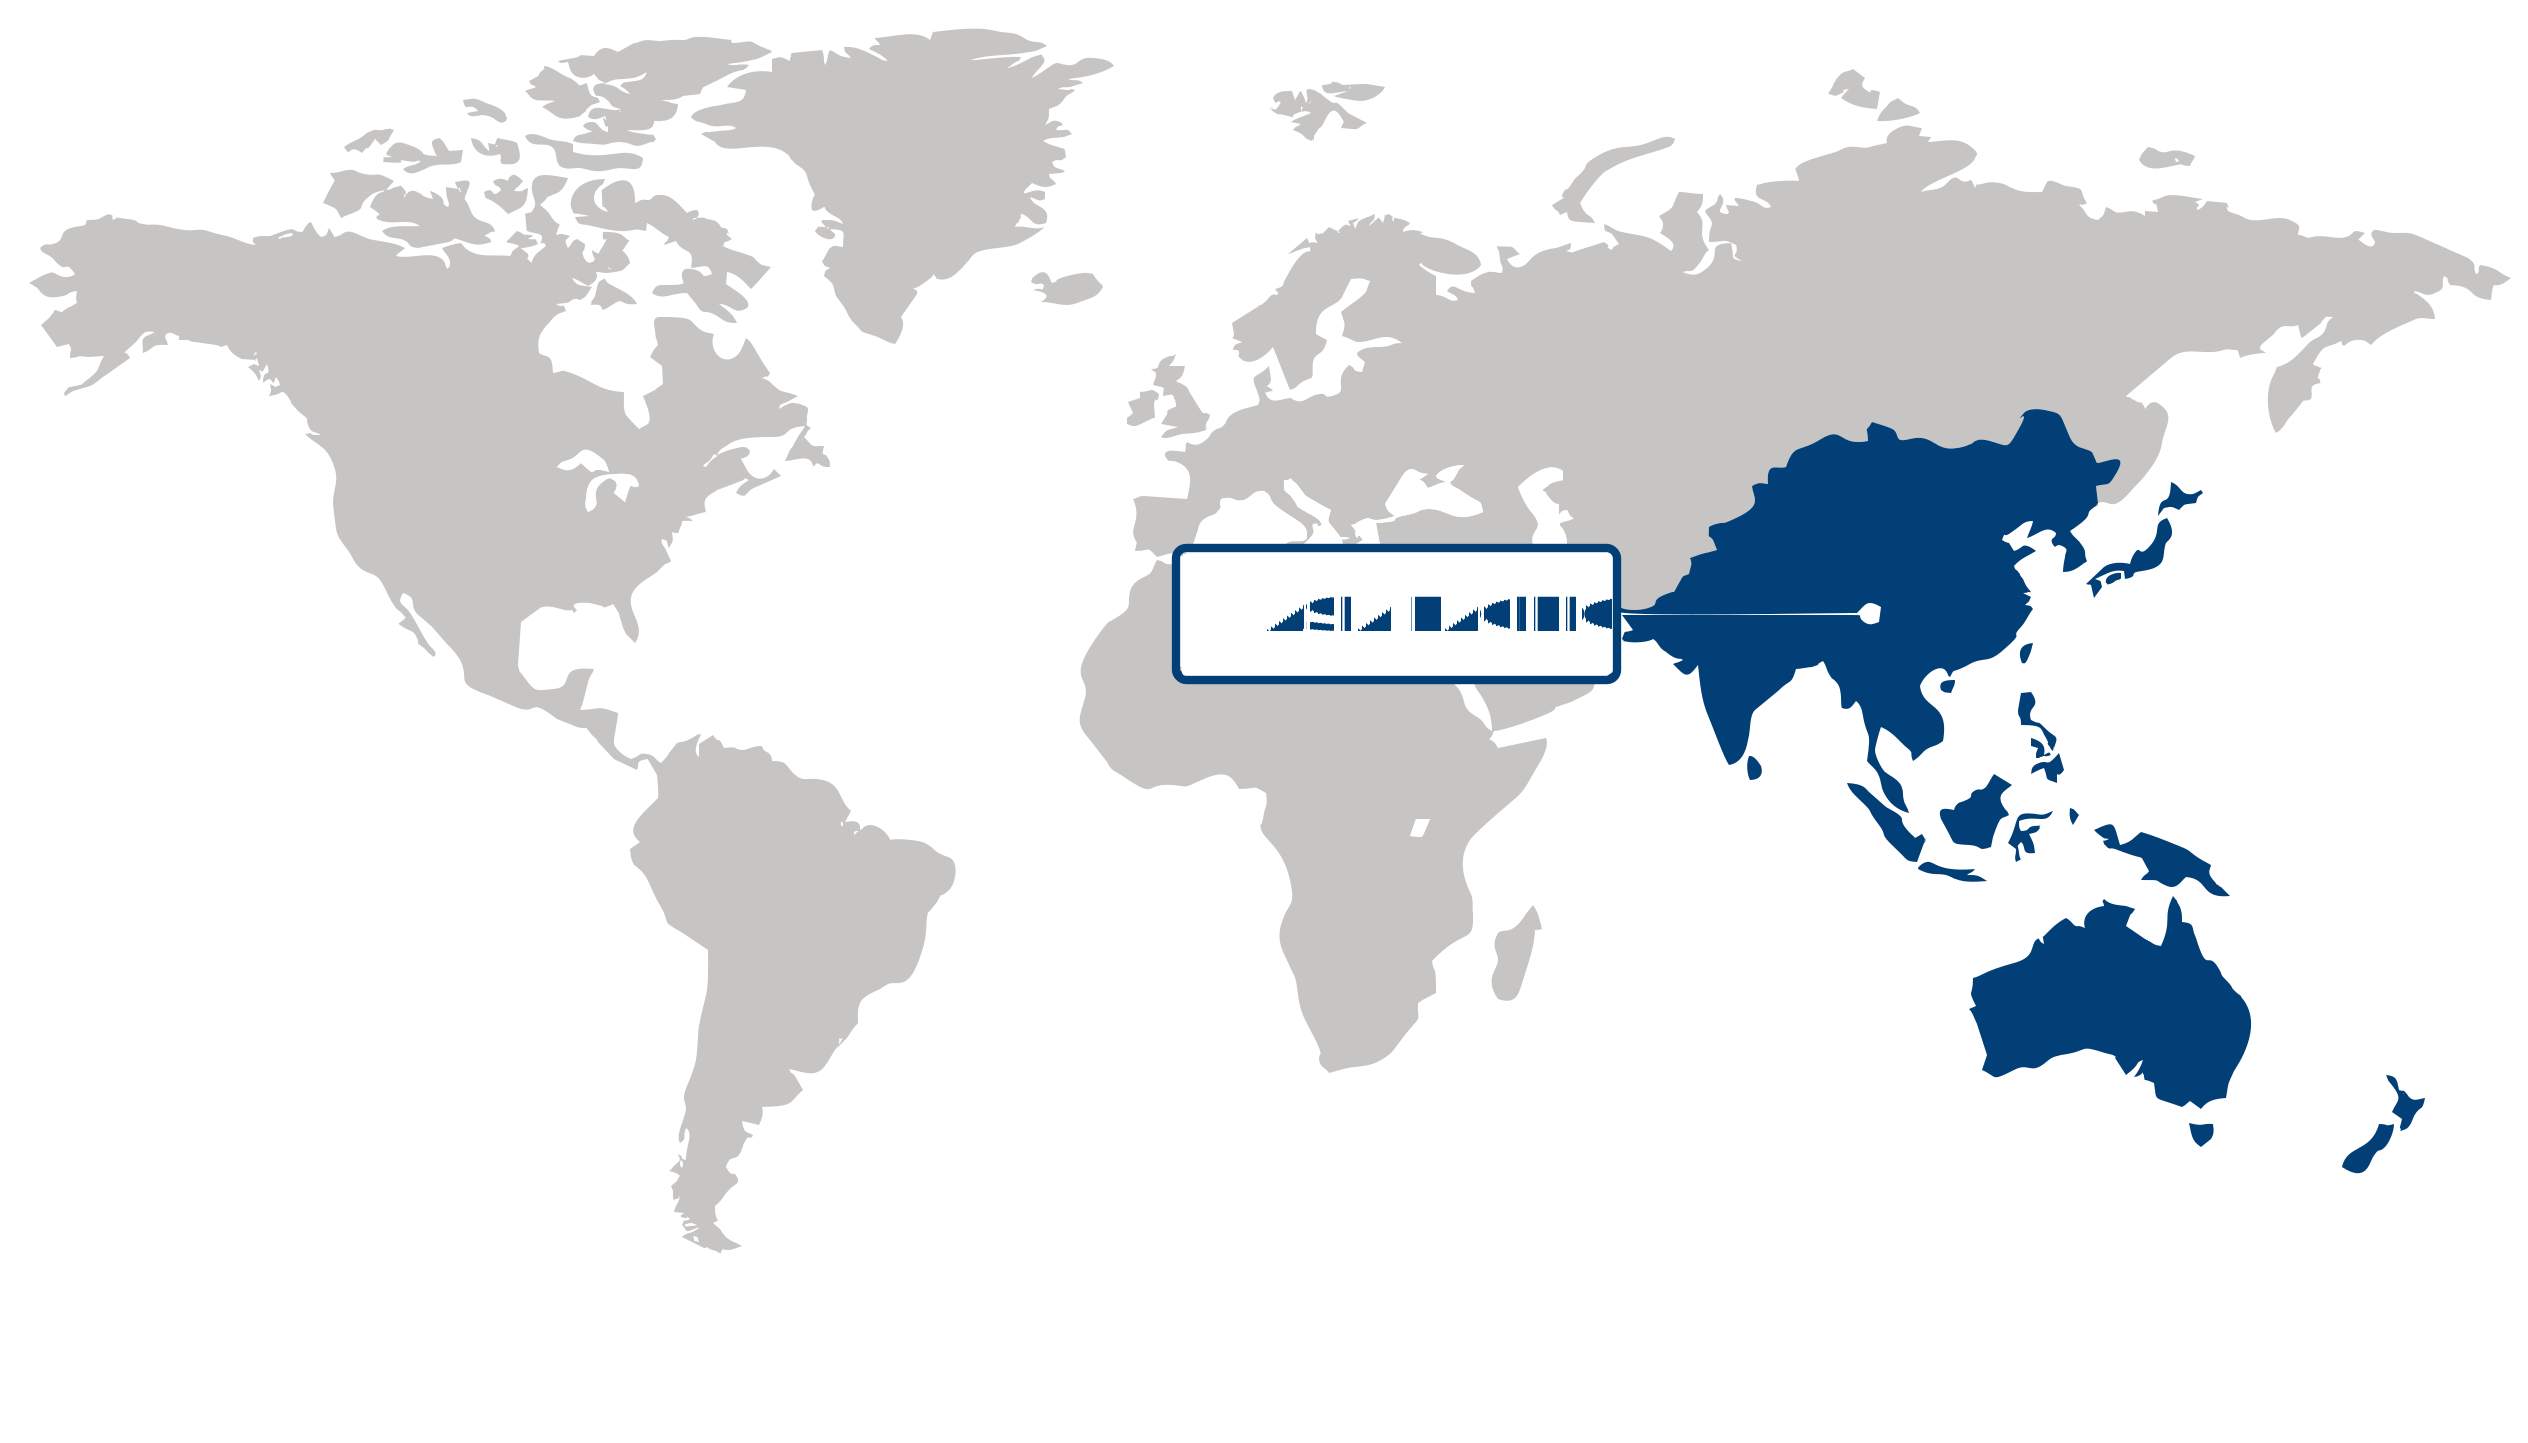
Asia Pacific captured approximately 41.00% of the global quantum dots (QD) market in 2025, establishing it as the largest regional player. High consumer electronics demand—particularly for smartphones and energy-efficient displays—drives adoption as manufacturers push for wider color gamut and lower power consumption. Samsung Electronics and BOE Technology Group announcements on expanded quantum-dot display capacity, together with policy signals from the Ministry of Industry and Information Technology of the People's Republic of China and the Ministry of Economy, Trade and Industry (Japan), provide qualitative evidence of commercial scale and public‑private R&D support. Deep supplier networks and logistics efficiency sustain competitive pricing and rapid deployment. Forward-looking, the region’s combination of OEM demand, manufacturing scale and targeted R&D makes Asia Pacific the primary opportunity zone for QD-enabled consumer and industrial displays.
Japan is positioned as a pivotal hub in Asia Pacific for the quantum dots (QD) market, driven by premium OEM demand and advanced materials research. Sony Corporation and Japan Display Inc. exemplify demand for high‑performance panels in TVs, professional monitors and automotive interfaces, while New Energy and Industrial Technology Development Organization (NEDO) and the Ministry of Economy, Trade and Industry (Japan) fund materials and pilot production programs. The result is a specialization in high‑margin segments and upstream IP development that complements regional volume leaders. Strategically, Japan’s strengths in materials science and premium product integration offer investors entry points into differentiated, higher‑value segments across Asia Pacific.
China anchors the Asia Pacific scale advantage in the quantum dots (QD) market through large domestic consumption and vertically integrated panel manufacturing. BOE Technology Group and TCL Corporation have publicized investments in quantum-dot-enabled panels and capacity expansion, backed by supportive measures from the Ministry of Industry and Information Technology of the People's Republic of China to localize supply chains. This combination accelerates cost reduction and broad adoption across smartphones, TVs and public displays, leveraging scale and logistics to shorten time-to-market. For strategists, China presents volume-led commercialization pathways and partner ecosystems that can rapidly scale QD technologies across the region.
North America Market Analysis:
North America emerged as the fastest-growing region in the quantum dots (QD) market, registering a robust CAGR of 22.32%. The region’s acceleration is driven by a rising emphasis on quantum dot research to explore new scopes in medical and industrial applications, reflected in growing public and private investment. Public funders such as the U.S. National Institutes of Health (NIH) and the National Science Foundation (NSF) have increased nanotechnology and imaging grants, while national labs including Argonne National Laboratory and Lawrence Berkeley National Laboratory advance scalable synthesis and characterization. Commercial players like Nanosys demonstrate downstream commercialization pathways for display and sensor applications. Combined research intensity, specialized manufacturing capacity, and regulatory engagement with the U.S. Food and Drug Administration (FDA) position North America for rapid translation of laboratory innovations into market-ready QD products.
The United States is the primary commercial and translational hub within North America for the quantum dots (QD) market, leveraging dense research clusters and venture capital. NIH-supported biomedical projects in university hospitals and DOE-supported materials programs at Argonne accelerate clinical imaging and industrial sensing prototypes, while companies such as Nanosys and partnerships with display OEMs convert materials advances into products. The FDA’s evolving interactions around nanoscale materials influence clinical and diagnostic adoption timelines, and a skilled workforce concentrated in U.S. research centers shortens commercialization cycles. Strategic implication: U.S. leadership in research-to-market pathways will anchor regional demand and attract supply-chain investment, reinforcing North America’s status as the fastest-growing QD market.
Europe Market Trends:
The quantum dots (QD) market in Europe shows high potential, maintained notable presence as a nexus of public R&D, specialty materials expertise, and rising end-market demand for premium displays and biosensing. European Commission initiatives such as the Quantum Flagship and Horizon Europe have prioritized quantum materials, while the European Investment Bank has signaled financing for advanced-tech scale-up; industry players like Nanoco Group and Merck KGaA and research organizations including Fraunhofer institutes and CEA demonstrate active commercialization and applied-research pathways in press releases and program statements. This convergence of funding, capabilities, and sustainability-driven customer requirements positions Europe for targeted scale-up and supplier consolidation across the value chain.
The quantum dots (QD) market in Germany plays a leading industrial role, anchored by specialty-chemicals firms and precision-manufacturing ecosystems that accelerate pilot production and systems integration. BASF’s materials research and Merck KGaA’s performance materials divisions, together with Fraunhofer Society programs on photonics and device integration, provide industrial channels into automotive displays, augmented-reality optics, and sensor modules referenced in company releases and institute publications. Germany’s manufacturing depth suggests strategic value for investors seeking de-risked scale-up partners and regional production capacity that complements broader European commercialization.
The quantum dots (QD) market in France is anchored in research-driven innovation, with national labs and targeted public funding creating strong translational pipelines. CEA-Leti and CNRS collaborations, ANR-funded consortia, and corporate partnerships involving organizations such as Thales illustrate pathways from materials science to photonics and medical-diagnostics prototypes described in institutional announcements. France’s bench-to-market capabilities offer high-quality IP and early-stage ventures that, when paired with German manufacturing and EU funding, create a compelling regional platform for investors focused on deep-tech commercialization.
| Parameter | North America | Asia Pacific | Europe | Latin America | MEA |
|---|---|---|---|---|---|
| Innovation Hub i Scale Nascent Developing Advanced | |||||
| Cost-Sensitive Region i Scale Low Medium High | |||||
| Regulatory Environment i Scale Restrictive Neutral Supportive | |||||
| Demand Drivers i Scale Weak Moderate Strong | |||||
| Development Stage i Scale Emerging Developing Developed | |||||
| Adoption Rate i Scale Low Medium High | |||||
| New Entrants / Startups i Scale Sparse Moderate Dense | |||||
| Macro Indicators i Scale Weak Stable Strong |
Segment Leadership and Growth Trends
Quantum Dots (QD) Market Share (%), by Type, 2026
Go beyond the chart, access full insights & data tables
Request Free Sample ReportII-VI-Semiconductors dominated the quantum dots (QD) market in 2025, capturing the largest share among Type segments due to widespread adoption in advanced display technologies such as QLED TVs and monitors that demand superior color accuracy and energy efficiency. Manufacturers like Samsung Electronics and materials specialist Nanosys demonstrate commercial deployment of II-VI-based films, while II‑VI Incorporated supplies critical semiconductor components, reflecting supply-chain consolidation and OEM preference for validated performance. This leadership opens strategic advantages for incumbent suppliers to scale vertically and for entrants to specialize in cadmium-free formulations and supply resiliency; ongoing display innovation and energy-efficiency priorities support continued relevance in the near to medium term.
Analysis by Application
Optoelectronics & Optical Components represented largest share in 2025 in the quantum dots (QD) market among Application segments, propelled by integration of QDs into displays, lighting systems and optical modules for enhanced gamut and luminous efficacy. Commercial examples from Samsung Electronics' QLED product lines and Nanosys' component partnerships underscore buyer demand for color-critical solutions, while research support from the U.S. Department of Energy on solid-state lighting accelerates technology maturation. Firms can pursue opportunities in specialty films, automotive lighting and AR/VR optics, and the segment's alignment with sustainability-driven energy savings and ongoing digital-display upgrades suggests durable demand through the near to medium term.
| Segment | Sub-Segment | Largest Segment | Fastest Growing |
|---|---|---|---|
| Type | II-VI-Semiconductors, III-V-Semiconductors, Silicon | ||
| Application | Medicine, Optoelectronics & Optical Components, Alternative Energy, Agriculture, Others |
Competitive Landscape and Market Positioning
The competitive landscape sees firms extending end-to-end capability and tightening links with adjacent industries and research centers. Leading players are folding complementary teams into their stacks, co-developing closely with device makers, refreshing product lines for displays and bioimaging, and boosting pilot capacity and IP depth. Those moves sharpen differentiation, accelerate OEM adoption, and push mid-tier firms toward specialization or scale-seeking collaborations, collectively raising barriers to late entry and accelerating technical maturation.
Strategic / Actionable Recommendations for Regional Players
North America: Leverage proximity to device manufacturers and research institutions by deepening operational links, aligning materials work with system integration needs, and concentrating on premium display and biomedical probe niches to secure higher-value engagements.
Asia Pacific: Capitalize on dense manufacturing ecosystems by situating pilot capacity near production clusters, tailoring formulations for high-volume display and lighting segments, and coordinating closely with regional integrators to speed commercialization.
Europe: Build on specialty-chemistry and flexible-substrate strengths by reinforcing collaboration with precision component makers, advancing environmentally favorable formulations, and targeting differentiated product niches where quality commands a premium.
| Company | Market Share | Company Revenue | Revenue CAGR (%) | Product Portfolio | Geographic Presence | Innovation / R&D Focus | Strategic Developments |
|---|---|---|---|---|---|---|---|
| No companies available. | |||||||
Industry Development/News
| Company Name | Date | Key Development |
|---|
Customize Your Report
Explore examples of how this report can be tailored to different research needs, including custom segments, additional topics or chapters, and related reports. Click a section of the wheel or its numbered marker to explore the available options.
Quantum Dots (QD) Market — Custom Segments
| Segment | Sub-Segment |
|---|---|
| No segment data available. | |
Quantum Dots (QD) Market — Custom TOC
| Custom Chapter | Custom Details | ||
|---|---|---|---|
| No custom TOC data available. | |||
Need a different cut of the data?
Request Custom ResearchWhat is the market size of quantum dots?
How is the quantum dots (QD) industry projected to perform over the next decade?
Which territory dominates the quantum dots (QD) market share rankings?
In which region is the quantum dots sector expanding most rapidly?
What share does II-VI-semiconductors segment hold in the quantum dots (QD) sector as of 2025?
Where is the optoelectronics & optical components segment seeing the strongest adoption within the quantum dots (QD) industry?
Which organizations are considered leaders in the quantum dots (QD) landscape?
Our Clients
"Working with FBI has been a good experience. The market report provided a holistic view, covering everything from emerging trends to potential risks."
Semtech Corporation
"The experience was highly positive. The team showcased remarkable flexibility in adapting to our specific needs and delivered report that perfectly aligned with all our requirements."
TSMC
"What really stood out to me was how clearly and promptly the Fundamental Business Insights team communicated throughout. It made the collaboration feel effortless."
NXP Semiconductors
Our Research Team & Methodology
Every Fundamental Business Insights report is built by a dedicated vertical research team, validated through a structured primary-and-secondary methodology, and reviewed for accuracy before it reaches you.
Research Team Overview
Prepared by the Electronics & Semiconductors Research Team
Delivery
Published
Demand
Available
Support
Trust & Compliance
Research Domains
10 coverage areasResearch Intelligence
| Source | Reference |
|---|---|
| Semiconductor Industry Association (SIA) | www.semiconductors.org |
| SEMI | www.semi.org |
| JEDEC Solid State Technology Association | www.jedec.org |
| IEEE | www.ieee.org |
| IPC – Association Connecting Electronics Industries | www.ipc.org |
| International Electrotechnical Commission (IEC) | www.iec.ch |
| International Organization for Standardization (ISO) | www.iso.org |
| U.S. Bureau of Industry and Security (BIS) | www.bis.gov |
| U.S. Patent and Trademark Office (USPTO) | www.uspto.gov |
| European Patent Office (EPO) | www.epo.org |
| Taiwan Semiconductor Industry Association (TSIA) | www.tsia.org.tw |
| World Semiconductor Trade Statistics (WSTS) | www.wsts.org |
| International Energy Agency (IEA) | www.iea.org |
| GSMA | www.gsma.com |
| 3GPP | www.3gpp.org |
| ITU (International Telecommunication Union) | www.itu.int |
| Omdia (public insights) | omdia.tech.informa.com |
| Display Supply Chain Consultants (DSCC) | www.displaysupplychain.com |
| U.S. Department of Energy (DOE) | www.energy.gov |
| NIST (National Institute of Standards and Technology) | www.nist.gov |
Research Workflow & Quality Assurance
Data Collection
Verified information gathered through primary and secondary research.
Data Triangulation
Cross-validation using multiple independent data sources.
Forecast Modelling
Market estimates developed using historical trends and analytical models.
Analyst Validation
Findings reviewed by domain experts for accuracy and consistency.
Editorial & Quality Review
Final editorial, quality, and compliance checks before publication.
Final Publication
Released after successful completion of the internal review process.
Report Coverage
📊 Market Assessment
- Market Size & Forecast
- Market Segmentation
- Regional Analysis
- Growth Drivers & Challenges
- Market Dynamics
🏢 Competitive Intelligence
- Competitive Landscape
- Company Profiles
- Competitive Benchmarking
- Mergers & Acquisitions
- Market Share Analysis or Key Company Strategies
🔍 Strategic Analysis
- Value Chain Analysis
- Porter's Five Forces
- PESTLE Analysis
- Pricing Trends
- Supply-Demand Analysis
🚀 Future Outlook
- Technology Landscape
- Regulatory Landscape
- Investment & Funding Landscape
- Emerging Opportunities
- Future Market Outlook
Have a question about this report or need a custom scope?
Request Customization