Olefins Market Size & Forecasts 2026-2035, By Segments (Distribution Channel, Type, Feedstock, Product Type, End-user, Application), Growth Opportunities, Innovation Landscape, Regulatory Shifts, Strategic Regional Insights (U.S., Japan, China, South Korea, UK, Germany, France), and Competitive Dynamics (ExxonMobil, SABIC, LyondellBasell, INEOS, Shell)
Market Size and Growth Outlook
Olefins Market size is predicted to expand from USD 273.83 billion in 2025 to USD 450.31 billion by 2035, with growth underpinned by a CAGR above 5.1% between 2026 and 2035. The industry revenue outlook for 2026 is USD 285.91 billion.
Get more details on this report
Request Free Sample ReportOlefins Market Intelligence Snapshot
Regional Market Dynamics
Segment Momentum
Market Expansion Drivers
Leading Market Participants
Global Market Forecast Snapshot
Market Outlook
Regional and Segment Outlook
Market Growth Drivers and Industry Trends
Global shifts toward higher-performance packaging and engineered plastics are driving demand for ethylene- and propylene-derived intermediates, reshaping the olefins market as converters seek specialty grades and recycled-content feedstocks. The American Chemistry Council has documented increasing polymer demand in packaging and construction, while Dow and LyondellBasell have announced capacity and product development initiatives to capture downstream value. Established producers can monetize scale and integrated supply chains by supplying tailored intermediates and recycling-compatible grades; new entrants can win share by partnering with converters on niche formulations or closed-loop solutions. Given public commitments by major producers, alignment with converters and recyclers will determine which players capture premium streams.
Expansion of petrochemical and industrial production
Recent upstream and integrated project builds — exemplified by Saudi Aramco and SABIC’s capacity expansions and ExxonMobil’s Gulf Coast Growth Project — are altering feedstock flows and logistics, materially influencing the olefins market by increasing regionally concentrated supply and lowering delivered costs in proximate demand centers. These large-scale investments create advantages for incumbents with integrated refining-to-chemicals platforms and logistics networks, while opening margin opportunities for smaller operators to serve under‑supplied local markets or provide tolling and specialty downstream services. Observable facility startups and pipeline tie‑ins indicate that proximity to feedstock and downstream customers will be an actionable competitive lever.
Technological advancements in olefin production
Innovations in catalyst design, electrified cracking pilots, and digital process optimization from licensors and technology providers such as Haldor Topsoe, Honeywell UOP, Siemens Energy, and Johnson Matthey are improving yields, feedstock flexibility, and emissions intensity, directly affecting capital and operating choices across the olefins market. licensors and incumbent operators can retrofit assets to lower carbon intensity and operating cost, while technology-focused entrants can commercialize modular or low‑emission units that address specific regional constraints. As equipment vendors and licensors publicize pilots and commercialization roadmaps, operators that adopt proven process upgrades and digital control systems will be positioned to improve margins and compliance simultaneously.
Industry Restraints:
Feedstock Price Volatility and Feedstock Competition
Volatility in naphtha, ethane and propane prices materially compresses olefins margins by forcing frequent feedstock switching and suboptimal cracker yields; the U.S. Energy Information Administration (EIA) documents the shale-gas-driven ethane cost advantage in North America, while International Energy Agency (IEA) analyses highlight naphtha exposure in Asia and Europe. Shell plc and ExxonMobil investor materials have repeatedly cited feedstock economics as the primary driver of upstream-to-chemicals investment decisions, and Saudi Aramco’s integrated refining-chemicals strategy illustrates vertical hedging tactics. Strategically, incumbents with integrated refineries or flexible crackers gain resilience, while greenfield projects in high-cost regions face postponement; near-term outlook points to continued geographic arbitrage and capital allocation toward feedstock-flexible assets.
Decarbonization Regulations and Carbon Pricing
Tightening emissions standards and carbon pricing raise operating costs and capital requirements across olefins value chains: the European Commission’s EU Emissions Trading System (EU ETS) and Carbon Border Adjustment Mechanism (CBAM) increase the cost of carbon-intensive exports, and the IEA’s policy assessments stress accelerated regulatory tightening. BASF, LyondellBasell and INEOS have publicly announced low‑emissions roadmaps that underscore heavy investment needs in electrified crackers, hydrogen, and CCUS. For market players, this means large retrofit CAPEX for incumbents and higher entry costs for challengers but also first-mover advantages for low‑carbon producers; in the medium term regulatory pressure will reallocate volumes toward producers able to demonstrate lower cradle‑to‑gate emissions.
| Growth Driver | Impact on CAGR | Regulatory Influence | Geographic Relevance | Adoption Rate | Impact Timeline |
|---|---|---|---|---|---|
| Rising demand for chemical intermediates in plastics and polymers | 1.50% | Short term (≤ 2 yrs) | Asia Pacific, North America; Spillover: Europe | Medium | Fast |
| Expansion of petrochemical and industrial production | 1.20% | Medium term (2–5 yrs) | Europe, North America | Low | Moderate |
| Technological advancements in olefin production | 0.80% | Long term (5+ yrs) | Asia Pacific, Europe | Low | Slow |
Explore Growth Opportunities
Request Free Sample ReportRegional Demand Dynamics
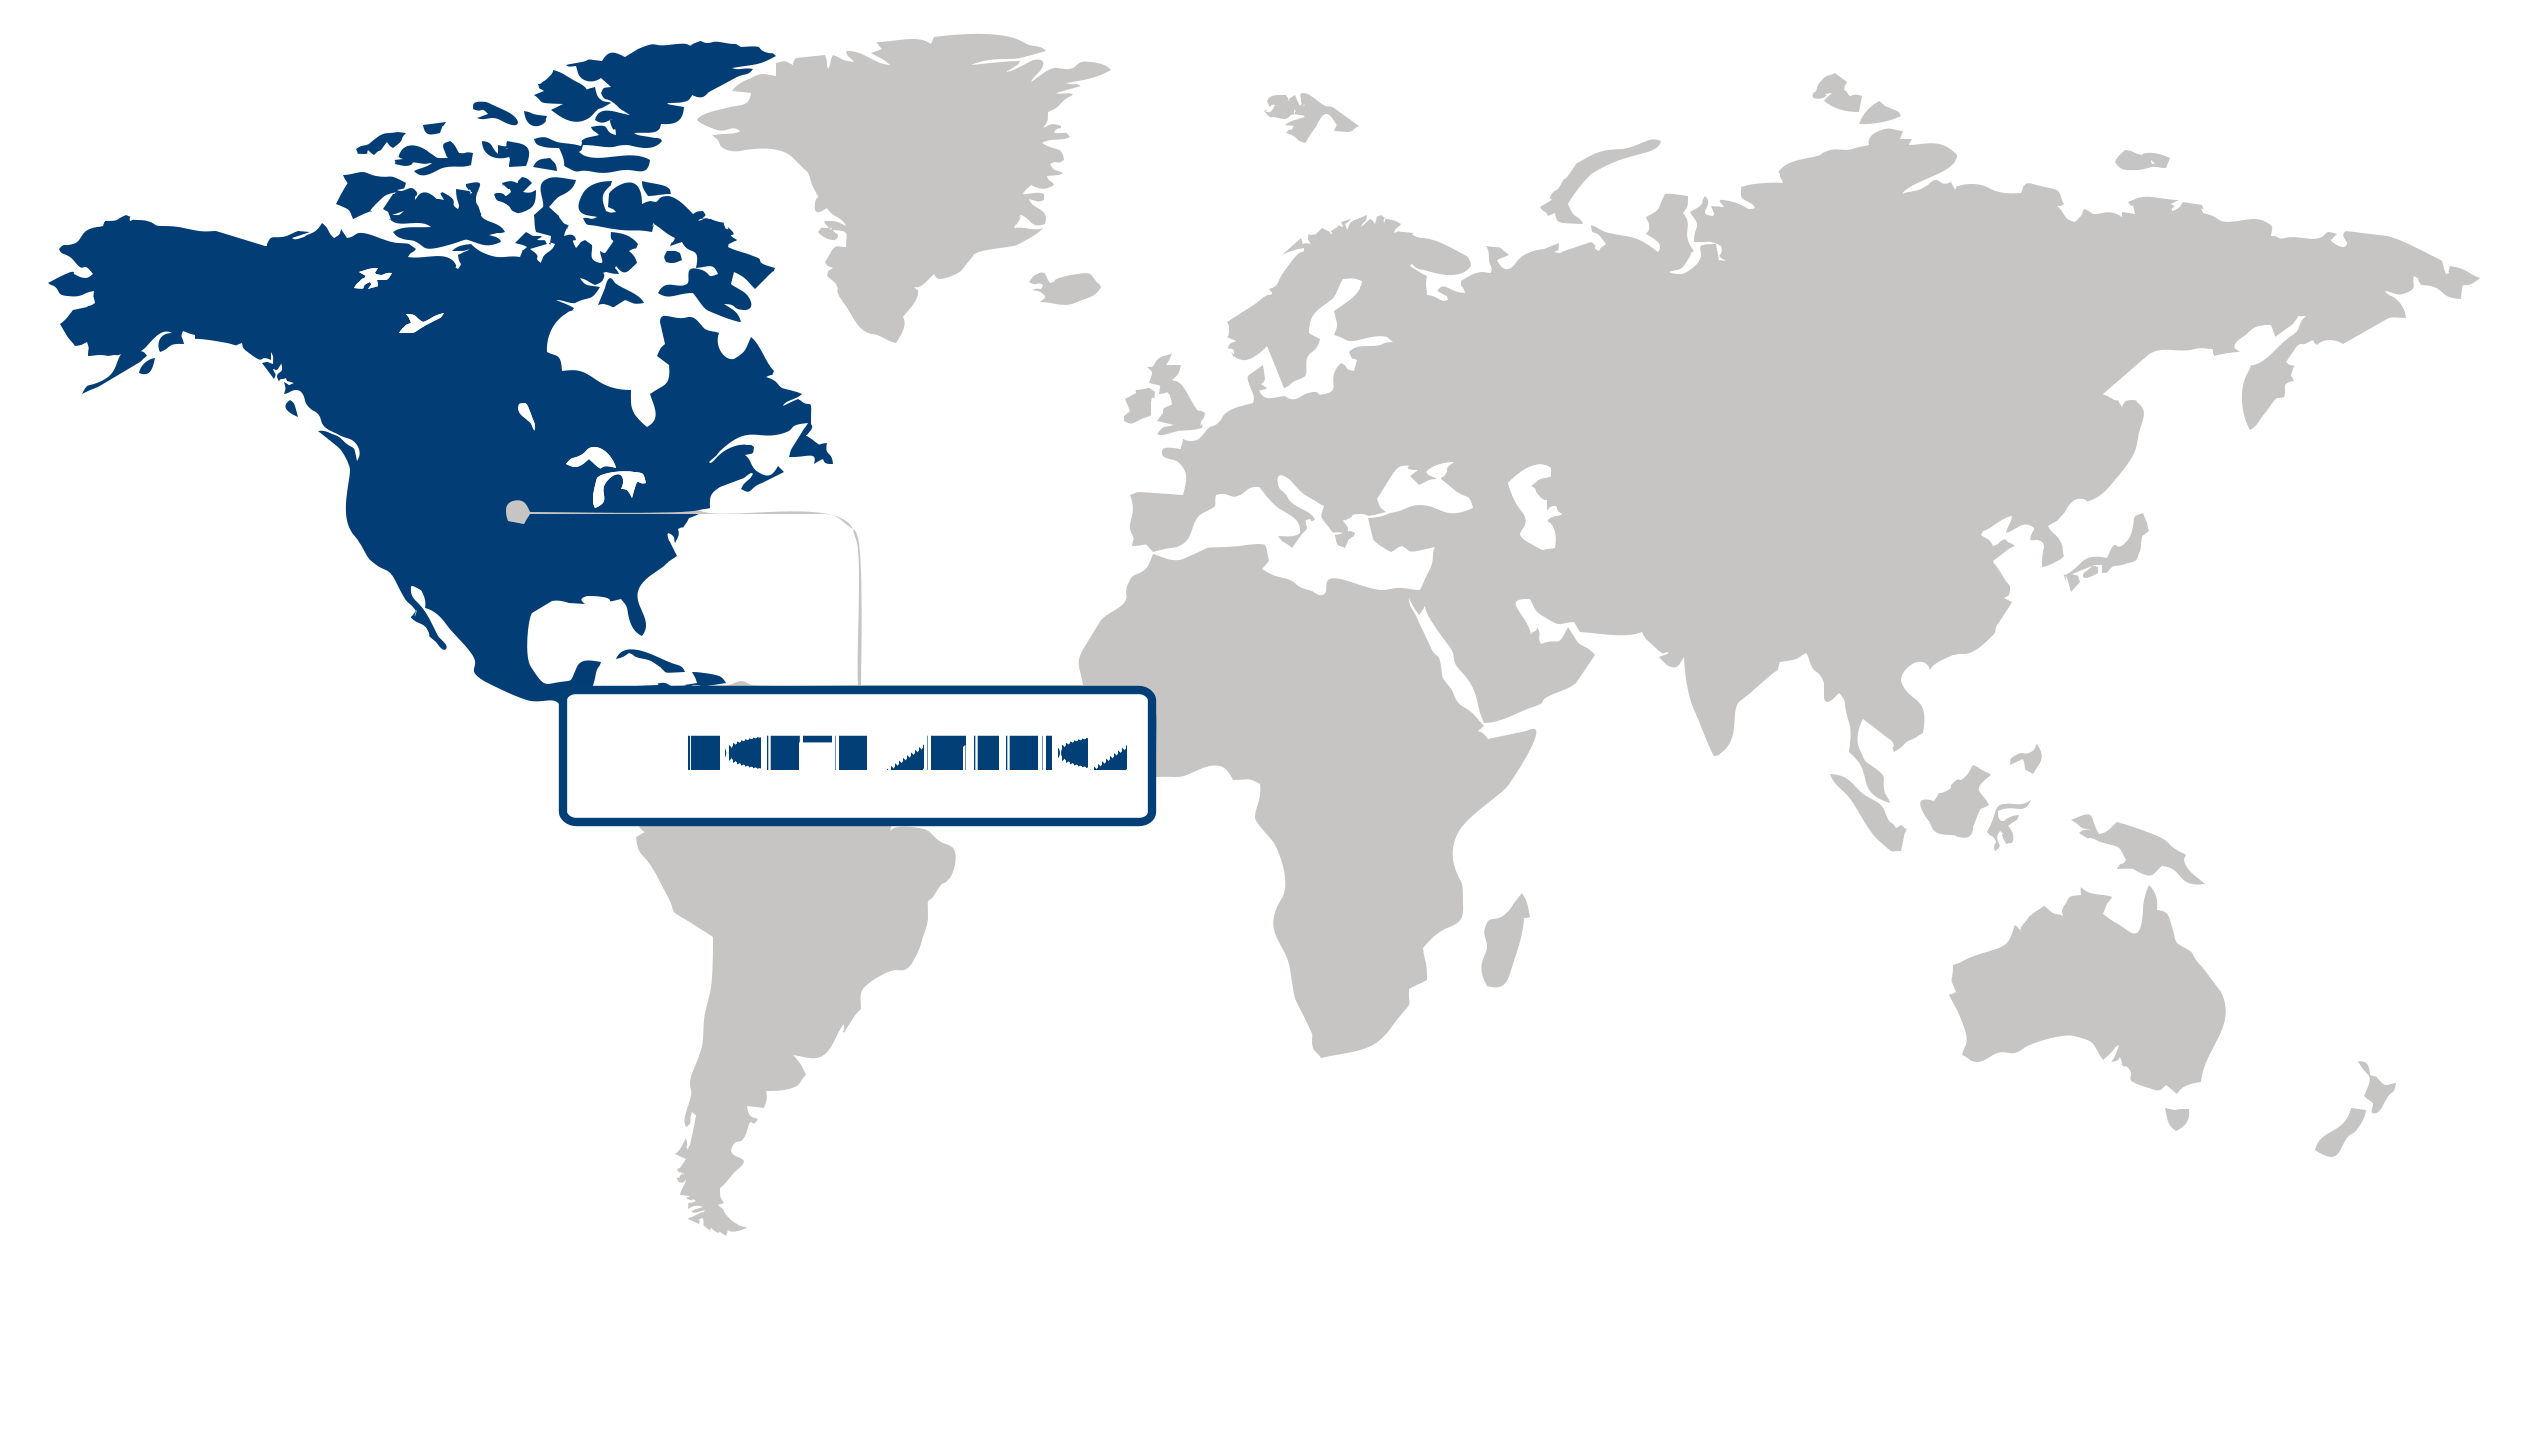
Captured 38.4% of the global olefins market in 2025, North America is the largest regional hub by share, propelled by abundant shale gas feedstock and a deep petrochemical manufacturing infrastructure. Cheap ethane from U.S. shale basins underpins feedstock economics—data from the U.S. Energy Information Administration show sustained NGL and ethane production—while the American Chemistry Council documents Gulf Coast capacity concentration that supports large-scale crackers and downstream integration. Corporate confirmations from ExxonMobil and Shell press releases on Gulf Coast investments reinforce ongoing capital flows. Shifts toward higher-performance plastics, investments in advanced recycling and emissions controls, and streamlined logistics further strengthen supply-demand linkages. These factors make North America a high-opportunity region for feedstock-advantaged expansion and for companies pursuing integrated, lower-cost production and circularity initiatives.
The United States anchors the North American olefins market as primary producer and export platform, where shale-derived ethane cost advantages and concentrated Gulf Coast complexes drive competitiveness. The U.S. Energy Information Administration highlights regional ethane surpluses that support cracker utilization, while U.S. Environmental Protection Agency policy and state permitting trends influence retrofit and decarbonization decisions. Company announcements from Dow and ExxonMobil signal optimization and capacity investment strategies that capture export demand and downstream specialization. Mature logistics corridors, engineering talent pools, and proximity to large end markets enable faster project execution. This scale and execution capability make the U.S. the strategic nucleus that reinforces North America’s regional leadership and export-driven opportunities in olefins.
Asia Pacific Market Analysis:
The olefins market in Asia Pacific emerged as the fastest-growing region, registering a robust CAGR of 6.5%, driven by rapid urbanization and the expansion of regional construction and automotive sectors. Urban migration and large-scale infrastructure programs documented by the World Bank and China National Bureau of Statistics are sustaining demand for construction plastics and packaging, while automotive electrification and lightweighting initiatives by manufacturers such as Toyota Motor Corporation and BYD are increasing demand for polymer feedstocks. Integrated petrochemical investments from groups including China Petroleum & Chemical Corporation (Sinopec) and Formosa Plastics are improving regional supply security and vertical integration. Combined policy signals from the State Council of the People’s Republic of China and Japan’s Ministry of Economy, Trade and Industry are accelerating capacity modernization and circular-material initiatives. These dynamics position Asia Pacific to capture both volume growth and a shift toward higher-value olefin derivatives over the medium term.
The olefins market in Japan functions as a premium, innovation-led segment where demand is concentrated in high-performance resins for automotive and advanced construction applications. Japan’s aging-buildings renovation cycle and stringent product standards reported by the Ministry of Land, Infrastructure, Transport and Tourism favor specialty grades and recycled-content solutions; companies such as Mitsubishi Chemical and Toyota Motor Corporation are investing in materials innovation and circular pilot projects. Tight logistics, skilled technical workforce availability, and regulatory emphasis on decarbonization under METI support adoption of higher-margin, lower-carbon olefin products. Strategically, Japan offers partners regional producers a testbed for premium formulations and advanced recycling technologies that can be scaled across Asia Pacific.
The olefins market in China is volume-driven and pivotal to regional scale, underpinned by urban construction growth and the country’s dominant vehicle production ecosystem. Data and policy guidance from the State Council and China National Bureau of Statistics show sustained fixed-asset investment in infrastructure and elevated vehicle manufacturing output, which incentivize capacity expansions by players such as Sinopec and regional petrochemical complexes. Local sourcing efficiencies, proximate feedstock access, and rapid downstream conversion capacity favor commodity-grade olefins while also enabling fast uptake of specialty derivatives for automotive lightweighting and building materials. For investors and strategists, China’s scale creates supply-cost advantages and a platform for exporting both feedstock and finished polymer solutions across Asia Pacific.
Europe Market Trends:
Europe's olefins market held a substantial share of regional petrochemical output, driven by dense demand for packaging, automotive components, and construction materials and by coordinated policy shifts such as the European Commission’s Green Deal and REACH updates that are reshaping feedstock choice and capital allocation. Recent supplier activity—INEOS's capacity announcements and BASF’s modernization statements—alongside PlasticsEurope consumption data and Eurostat manufacturing statistics, illustrate how producers are prioritizing retrofit, electrification pilots, and recycled-content routes to sustain competitiveness. Given deep industrial clusters, skilled labor pools, and accelerating digitalization across plants, Europe provides investors a sizable platform for scaling circular-chemistry technologies and low-emission crackers over the coming decade.
Germany's olefins market is the region's production and innovation hub, anchored by large-scale sites and advanced downstream conversion. Strong industrial demand from automotive and machinery sectors and rapid adoption of process digitalization are evident in BASF’s Ludwigshafen modernization disclosures and Covestro’s efficiency programs, while the Verband der Chemischen Industrie and the Bundesministerium für Wirtschaft und Klimaschutz highlight policies to support industrial electrification and skills development. These dynamics make Germany a strategic locus for high-throughput, high-value olefin derivatives and for piloting digital/operational excellence that can be replicated across Europe.
France's olefins market acts as an integrated feedstock-export platform with coastal complexes that support both domestic converters and regional trade flows. TotalEnergies’ investments in Normandy and Port-Jérôme site announcements, together with EDF’s role in grid stability and the Ministère de la Transition écologique’s industrial energy measures, show how proximity to refineries, port logistics, and energy infrastructure underpin competitive export economics. France’s integrated site model and export orientation present strategic opportunities to secure feedstock flexibility and to link low-carbon hydrogen or electrification projects to broader European supply-chain resilience.
| Parameter | North America | Asia Pacific | Europe | Latin America | MEA |
|---|---|---|---|---|---|
| Innovation Hub i Scale Nascent Developing Advanced | |||||
| Cost-Sensitive Region i Scale Low Medium High | |||||
| Regulatory Environment i Scale Restrictive Neutral Supportive | |||||
| Demand Drivers i Scale Weak Moderate Strong | |||||
| Development Stage i Scale Emerging Developing Developed | |||||
| Adoption Rate i Scale Low Medium High | |||||
| New Entrants / Startups i Scale Sparse Moderate Dense | |||||
| Macro Indicators i Scale Weak Stable Strong |
Segment Leadership and Growth Trends
Olefins Market Share (%), by Distribution Channel, 2026
Go beyond the chart, access full insights & data tables
Request Free Sample ReportDistributors dominated the olefins market in 2025 as the largest share, supported by extensive distribution networks enabling efficient bulk chemical supply. This leadership reflects the Distribution Channel segments’ ability to deliver scale, inventory management and localized logistics—advantages cited in Brenntag’s global network descriptions and BASF’s distribution partnership announcements—that reduce lead times and support just‑in‑time procurement for downstream converters. Evolving customer preferences for service packages, digital ordering and resilient supply chains post‑pandemic have reinforced distributor value, while regulatory shifts favoring traceability increase demand for accredited partners. Established majors can expand integrated supply solutions and value‑added services; nimble entrants can niche into regional stocking and digital fulfillment. Given ongoing supply‑chain localization and digitalization trends, distributors are poised to retain strategic relevance near term.
Analysis by Type
Ethylene represented largest share in the olefins market in 2025, underpinned by strong demand for polyethylene and other ethylene derivatives in packaging applications. The Type segments lead because polyethylene remains the primary material for flexible and rigid packaging, a dynamic highlighted by the American Chemistry Council’s materials demand analyses and reinforced by the European Commission’s Packaging and Packaging Waste Directive driving material demand and recycling requirements. Shifts toward recycled-content mandates, customer demand for recyclable packaging, and innovations in specialty resins are reshaping product mixes and supplier offerings. Incumbent petrochemical producers can leverage integrated feedstock-to-resin chains and partnerships with brand owners, while agile players can capture margin by supplying high‑performance or recycled-content grades. With persistent packaging demand and regulatory focus on circularity, ethylene‑based products will stay central in the near to medium term.
Analysis by Feedstock
Natural Gas held largest share in the olefins market in 2025, driven by cost advantages and abundant availability of gas‑derived feedstocks. Feedstock segments relying on natural gas benefit from favorable feedstock economics and feedstock flexibility in regions with ample shale or gas reserves, a pattern documented by the U.S. Energy Information Administration and observed in industry strategy from Chevron Phillips Chemical regarding ethane cracking. Supply‑side developments, including pipeline expansions and LNG trade flows, plus digitalized operational control, have improved feedstock reliability and reduced unit costs. Opportunities include monetizing regional gas supplies, investing in gas‑based crackers, and pairing decarbonization technologies such as carbon capture—areas where large producers and specialized service providers can both compete. As long as gas availability and competitive economics persist alongside decarbonization investments tracked by the IEA, natural gas feedstock will remain a core base for olefins production.
| Segment | Sub-Segment | Largest Segment | Fastest Growing |
|---|---|---|---|
| Distribution Channel | Distributors, Wholesale | ||
| Type | Ethylene, Propylene, Butadiene, Others | ||
| Feedstock | Naphtha, Natural Gas, Coal, Others | ||
| Product Type | Olefin Oxides, Olefin Glycols, Ethylbenzene, Polyolefins, Cumene | ||
| End-user | Chemical, Automotive, Packaging, Consumer Goods, Others | ||
| Application | Synthetic Lubricants, Polyethylene, Detergent Alcohol, Cosmetics, Plasticizers, Adhesives, Others |
Unlock insights tailored to your business with our bespoke market research solutions.
Click to get your customized report now.
Competitive Landscape and Market Positioning
The competitive landscape is shaped by focused consolidation of complementary assets and an emphasis on deepening technical capabilities and product differentiation. Leading companies are broadening product suites through targeted asset integration and cross-border collaborations, while accelerating deployment of advanced cracking configurations, improved catalyst systems, and process intensification measures. Parallel moves to incorporate alternative feedstocks and improve downstream conversion options are reinforcing premium product placement and feedstock flexibility, prompting rivals to prioritize faster commercialization, tighter supply-chain partnerships, and selective upgrading of manufacturing footprints to defend margins and maintain innovation velocity.
Strategic / Actionable Recommendations for Regional Players
Leverage advantaged light-feed availability by strengthening upstream linkages with suppliers and co-developing pilot process upgrades with technology providers; prioritize development of differentiated polymer grades for automotive, medical, and high-performance packaging converters to capture higher margin niches and respond to competitors’ portfolio moves.
Scale through targeted integrations with regional converters and licensors while accelerating adoption of circular feed inputs and digital process optimization; focus on collaborative pilots that combine feedstock recycling, localized compounding, and customer co-creation to meet fast-evolving end-market requirements.
Align retrofit and new-capacity plans with decarbonization and material-circularity partners, securing long-term access to alternative feedstreams and utility partnerships; emphasize premium, sustainability-linked product offerings and coordinated sourcing agreements to defend against margin compression and regulatory shifts.
| Company | Market Share | Company Revenue | Revenue CAGR (%) | Product Portfolio | Geographic Presence | Innovation / R&D Focus | Strategic Developments |
|---|---|---|---|---|---|---|---|
| No companies available. | |||||||
Customize Your Report
Explore examples of how this report can be tailored to different research needs, including custom segments, additional topics or chapters, and related reports. Click a section of the wheel or its numbered marker to explore the available options.
Olefins Market — Custom Segments
| Segment | Sub-Segment |
|---|---|
| No segment data available. | |
Olefins Market — Custom TOC
| Custom Chapter | Chapter Details | ||
|---|---|---|---|
| No custom TOC data available. | |||
Need a different cut of the data?
Request Custom ResearchHow much revenue does the olefins market generate?
What are the growth projections for the olefins industry?
Which region shows the largest market footprint in the olefins market?
Which region is experiencing the fastest growth in the olefins sector?
What share does distributors segment hold in the olefins sector as of 2025?
Where is the ethylene segment seeing the strongest adoption within the olefins industry?
When did natural gas sub-segment emerge as the largest sub-segment in the feedstock segment of olefins sector?
Why is the polyolefins segment leading in the olefins industry?
Why does packaging sub-segment dominate the end-user segment of olefins sector?
How much is the polyethylene segment expected to grow in the olefins industry beyond 2025?
What are the prominent companies operating in the olefins landscape?
Our Clients
"The report helped us understand emerging consumer trends in our product category. It clarified where to focus innovation for the next product launch."
LyondellBasell
"The regional forecast section was incredibly useful. We were able to identify two new potential partners in Europe thanks to the vendor mapping you included."
SABIC
"We appreciated how actionable the recommendations were. It guided us to improve supply chain resilience."
Olin Corporation
Our Research Team & Methodology
Every Fundamental Business Insights report is built by a dedicated vertical research team, validated through a structured primary-and-secondary methodology, and reviewed for accuracy before it reaches you.
Research Team Overview
Prepared by the Chemicals & Materials Research Team
Delivery
Published
Demand
Available
Support
Trust & Compliance
Research Intelligence
| Source | Reference |
|---|---|
| American Chemistry Council (ACC) | www.americanchemistry.com |
| European Chemical Industry Council (Cefic) | cefic.org |
| International Council of Chemical Associations (ICCA) | icca-chem.org |
| European Chemicals Agency (ECHA) | echa.europa.eu |
| U.S. Environmental Protection Agency (EPA) | www.epa.gov |
| ASTM International | www.astm.org |
| International Organization for Standardization (ISO) | www.iso.org |
| National Institute of Standards and Technology (NIST) | www.nist.gov |
| Plastics Industry Association (PLASTICS) | www.plasticsindustry.org |
| European Biplastics | www.european-bioplastics.org |
| The Adhesive and Sealant Council (ASC) | www.ascouncil.org |
| National Association of Corrosion Engineers (AMPP) | www.ampp.org |
| Society of Plastics Engineers (SPE) | www.4spe.org |
| International Fertilizer Association (IFA) | www.fertilizer.org |
| CropLife International | croplife.org |
| Packaging Europe | packagingeurope.com |
| Flexible Packaging Association (FPA) | www.flexpack.org |
| Battery Council International (BCI) | batterycouncil.org |
| International Copper Association (ICA) | internationalcopper.org |
| World Steel Association | worldsteel.org |
Research Workflow & Quality Assurance
Data Collection
Verified information gathered through primary and secondary research.
Data Triangulation
Cross-validation using multiple independent data sources.
Forecast Modelling
Market estimates developed using historical trends and analytical models.
Analyst Validation
Findings reviewed by domain experts for accuracy and consistency.
Editorial & Quality Review
Final editorial, quality, and compliance checks before publication.
Final Publication
Released after successful completion of the internal review process.
Report Coverage
📊 Market Assessment
- Market Size & Forecast
- Market Segmentation
- Regional Analysis
- Growth Drivers & Challenges
- Market Dynamics
🏢 Competitive Intelligence
- Competitive Landscape
- Company Profiles
- Competitive Benchmarking
- Mergers & Acquisitions
- Market Share Analysis or Key Company Strategies
🔍 Strategic Analysis
- Value Chain Analysis
- Porter's Five Forces
- PESTLE Analysis
- Pricing Trends
- Supply-Demand Analysis
🚀 Future Outlook
- Technology Landscape
- Regulatory Landscape
- Investment & Funding Landscape
- Emerging Opportunities
- Future Market Outlook
Have a question about this report or need a custom scope?
Request Customization